USD/JPY double top forming at 135.16 monthly resistance?

Overview
A complete top down analysis of the USDJPY.
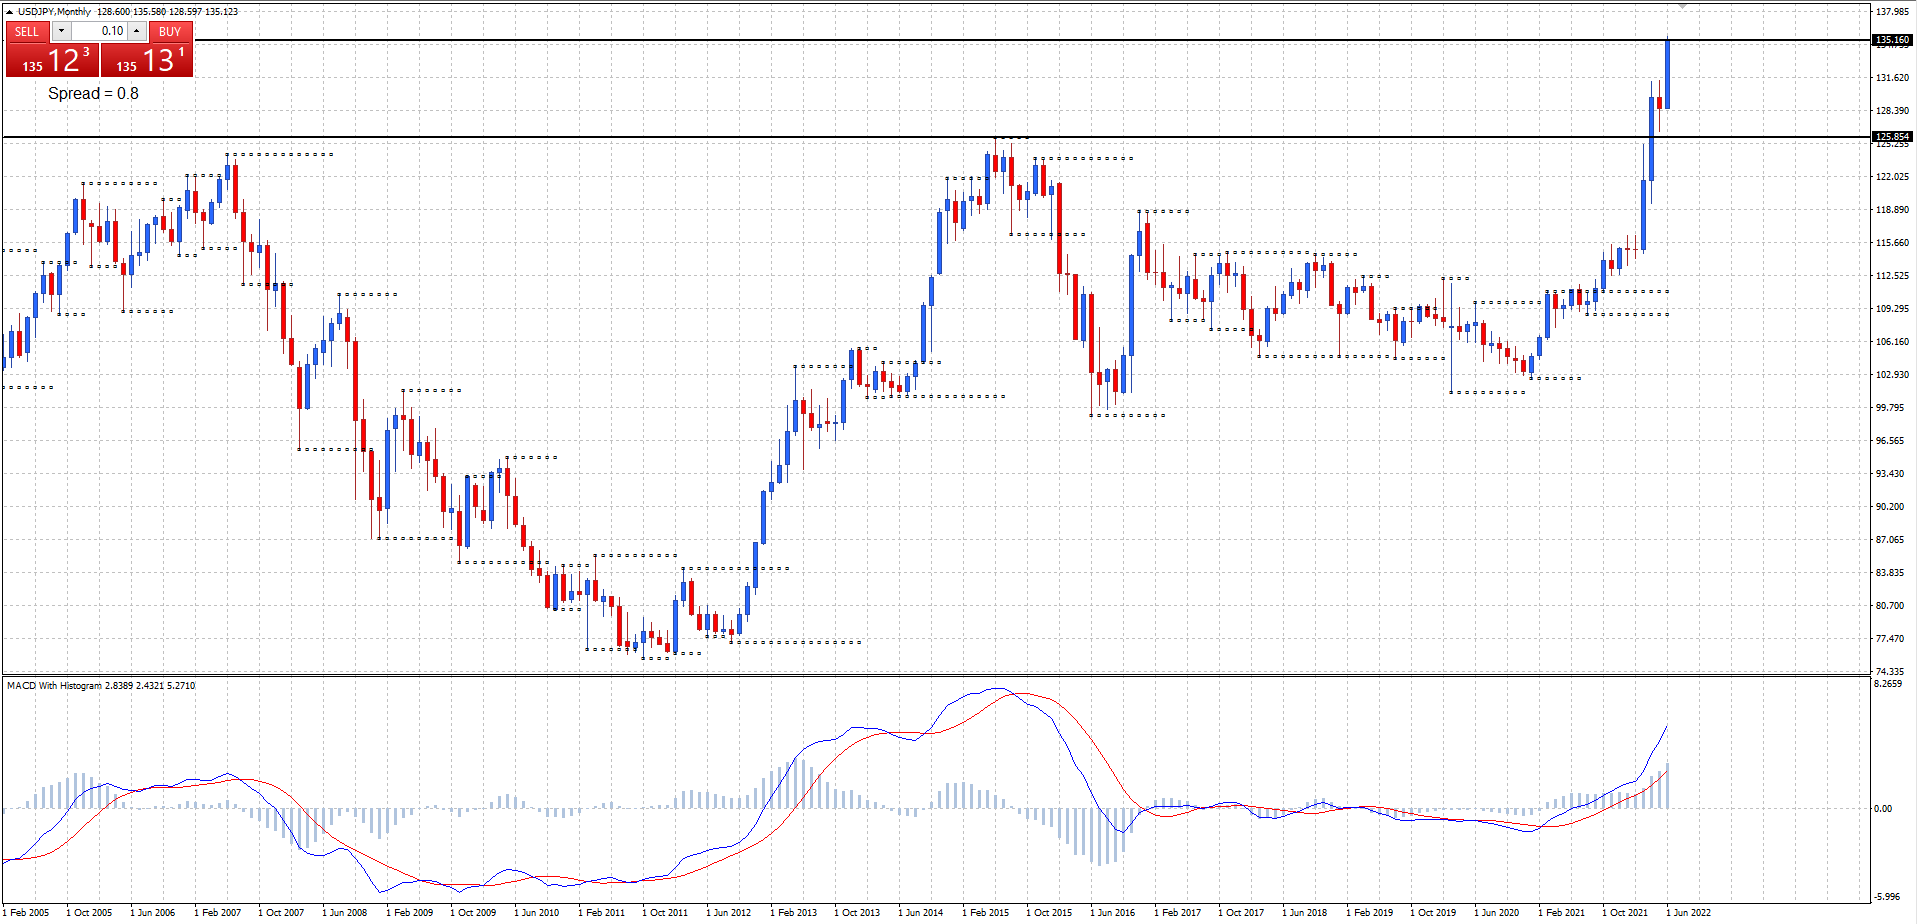
USD/JPY monthly
Monthly support at 125.85, resistance at 135.16.
Price has advanced back to the 135.16 monthly resistance level the major high formed in January 2002.
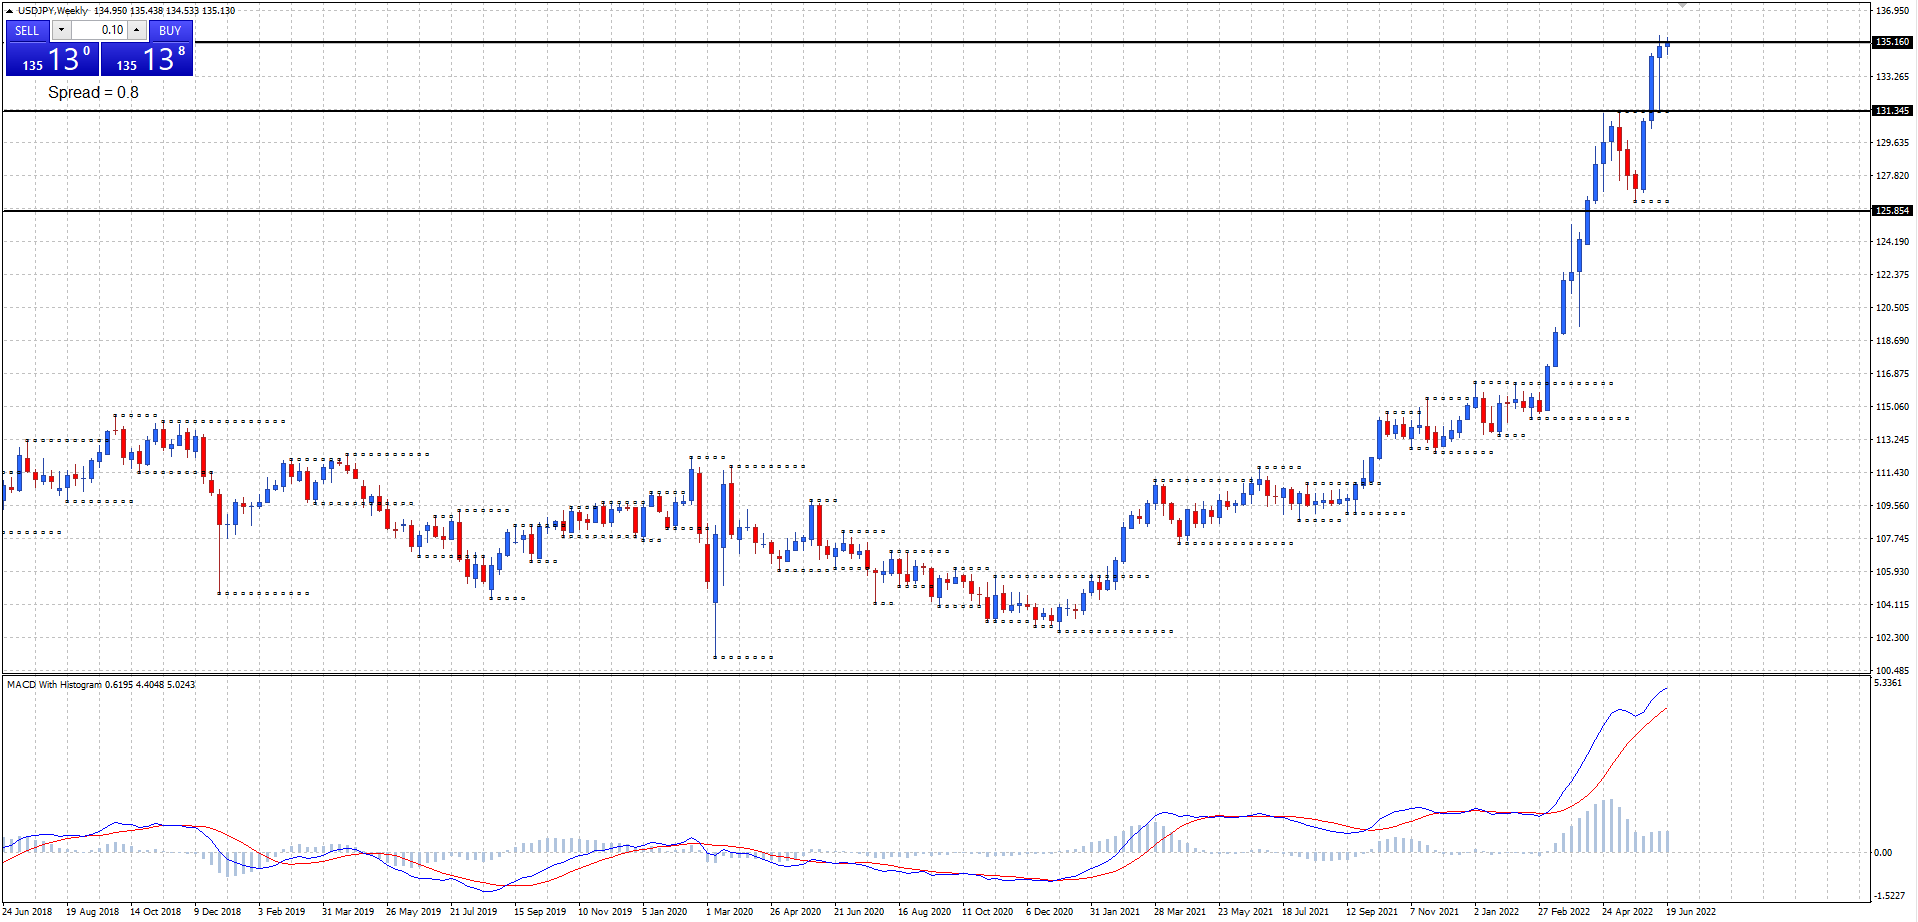
USD/JPY weekly
Weekly support at 131.34, resistance at 135.16.
Weekly chart is in an uptrend and price is testing the 135.16 monthly resistance level for the second week in a row. Will price hold or move above the 135.16 monthly resistance level?
USD/JPY daily
Daily support at 131.49, resistance at 135.58.
Daily chart is in an uptrend, but MACD may be forming negative divergence. A double top pattern may be forming at the 135.16 monthly resistance level. A break below 134.53 yesterday’s low would start to confirm the formation of a double top pattern on the daily chart.
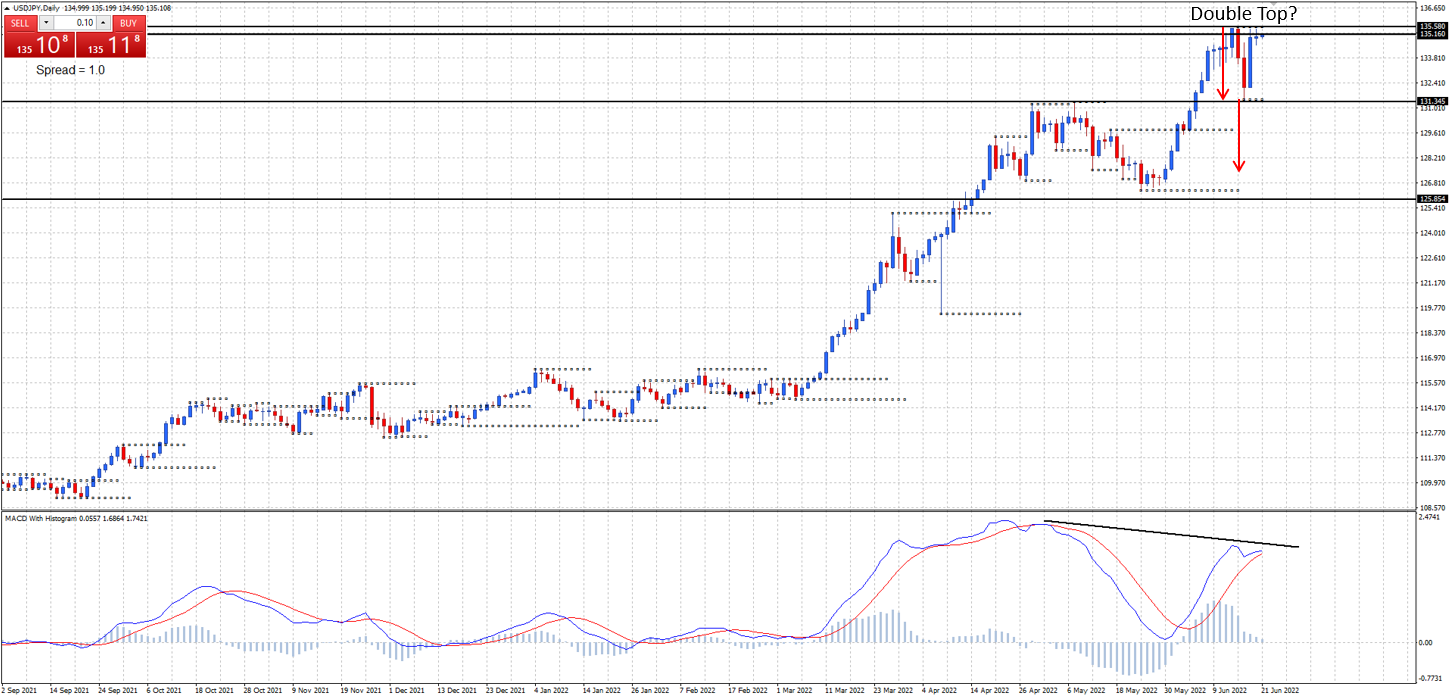
Short term target 131.34 weekly support. Double top price projection target 127.41.
Author

Duncan Cooper
ACY Securities
Duncan Cooper is a full-time trader and mentor. He has been actively trading the financial markets for more than 15 years and has traded stocks, options, futures, and the Forex Market since 2005.


