USD/CAD Price Forecast: Seems vulnerable amid Trump's tariff threats; Canadian CPI awaited
- USD/CAD spikes to a fresh multi-year top on Tuesday in reaction to Trump’s tariff remarks.
- A modest USD recovery from a two-week low further contributes to the strong move up.
- Declining US bond yields caps the USD and spot prices amid an uptick in Crude Oil prices.
- Traders also seem reluctant and opt to wait for the release of the Canadian CPI report.

The USD/CAD pair catches aggressive bids following the previous day's slump to over one-month low and touches its highest level since March 2020 in reaction to US President Donald Trump's remarks. Hours after taking the oath, Trump said that he was mulling over additional tariffs of around 25% on imports from Canada and Mexico starting from February 1. Trump accused the two major US trading partners of failing to stop illegal immigration and narcotics, and called Canada “a very bad abuser”. The announcement fueled concerns about the potential negative impact on the Canadian economy, which might force the Bank of Canada (BoC) to cut interest rates further. Apart from this, the recent pullback in Crude Oil prices from the highest level since July 2024, weighed on the commodity-linked Loonie.
The US Dollar (USD), on the other hand, stages a modest bounce from a two-week low touched on Monday amid expectations that Trump's protectionist policies would boost inflation and force the Federal Reserve (Fed) to stick to its hawkish stance. This turns out to be another factor that provides an additional boost to the USD/CAD pair and contributes to the strong move-up. Investors, meanwhile, have been betting that the Fed will lower borrowing costs twice this year on the back of signs of easing inflationary pressures. This, along with the global flight to safety, leads to a further decline in the US Treasury bond yields, which keeps a lid on the USD and the currency pair. Traders also seem reluctant and opt to wait for the release of the latest consumer inflation figures from Canada, due later today.
Investors are currently pricing in about a 75% chance that the BoC may lower its benchmark interest rate by 25 basis points on January 29. A softer Canadian Consumer Price Index (CPI) for December would reinforce market expectations and exert additional downward pressure on the CAD. In contrast, the immediate reaction to a stronger CPI print is likely to be limited amid the divergent Fed-BoC policy outlook and concerns about a possible economic fallout from Trump's trade policies. This, in turn, suggests that the path of least resistance for the USD/CAD pair is to the upside and any corrective pullback could be seen as an opportunity for bullish traders.
USD/CAD daily chart
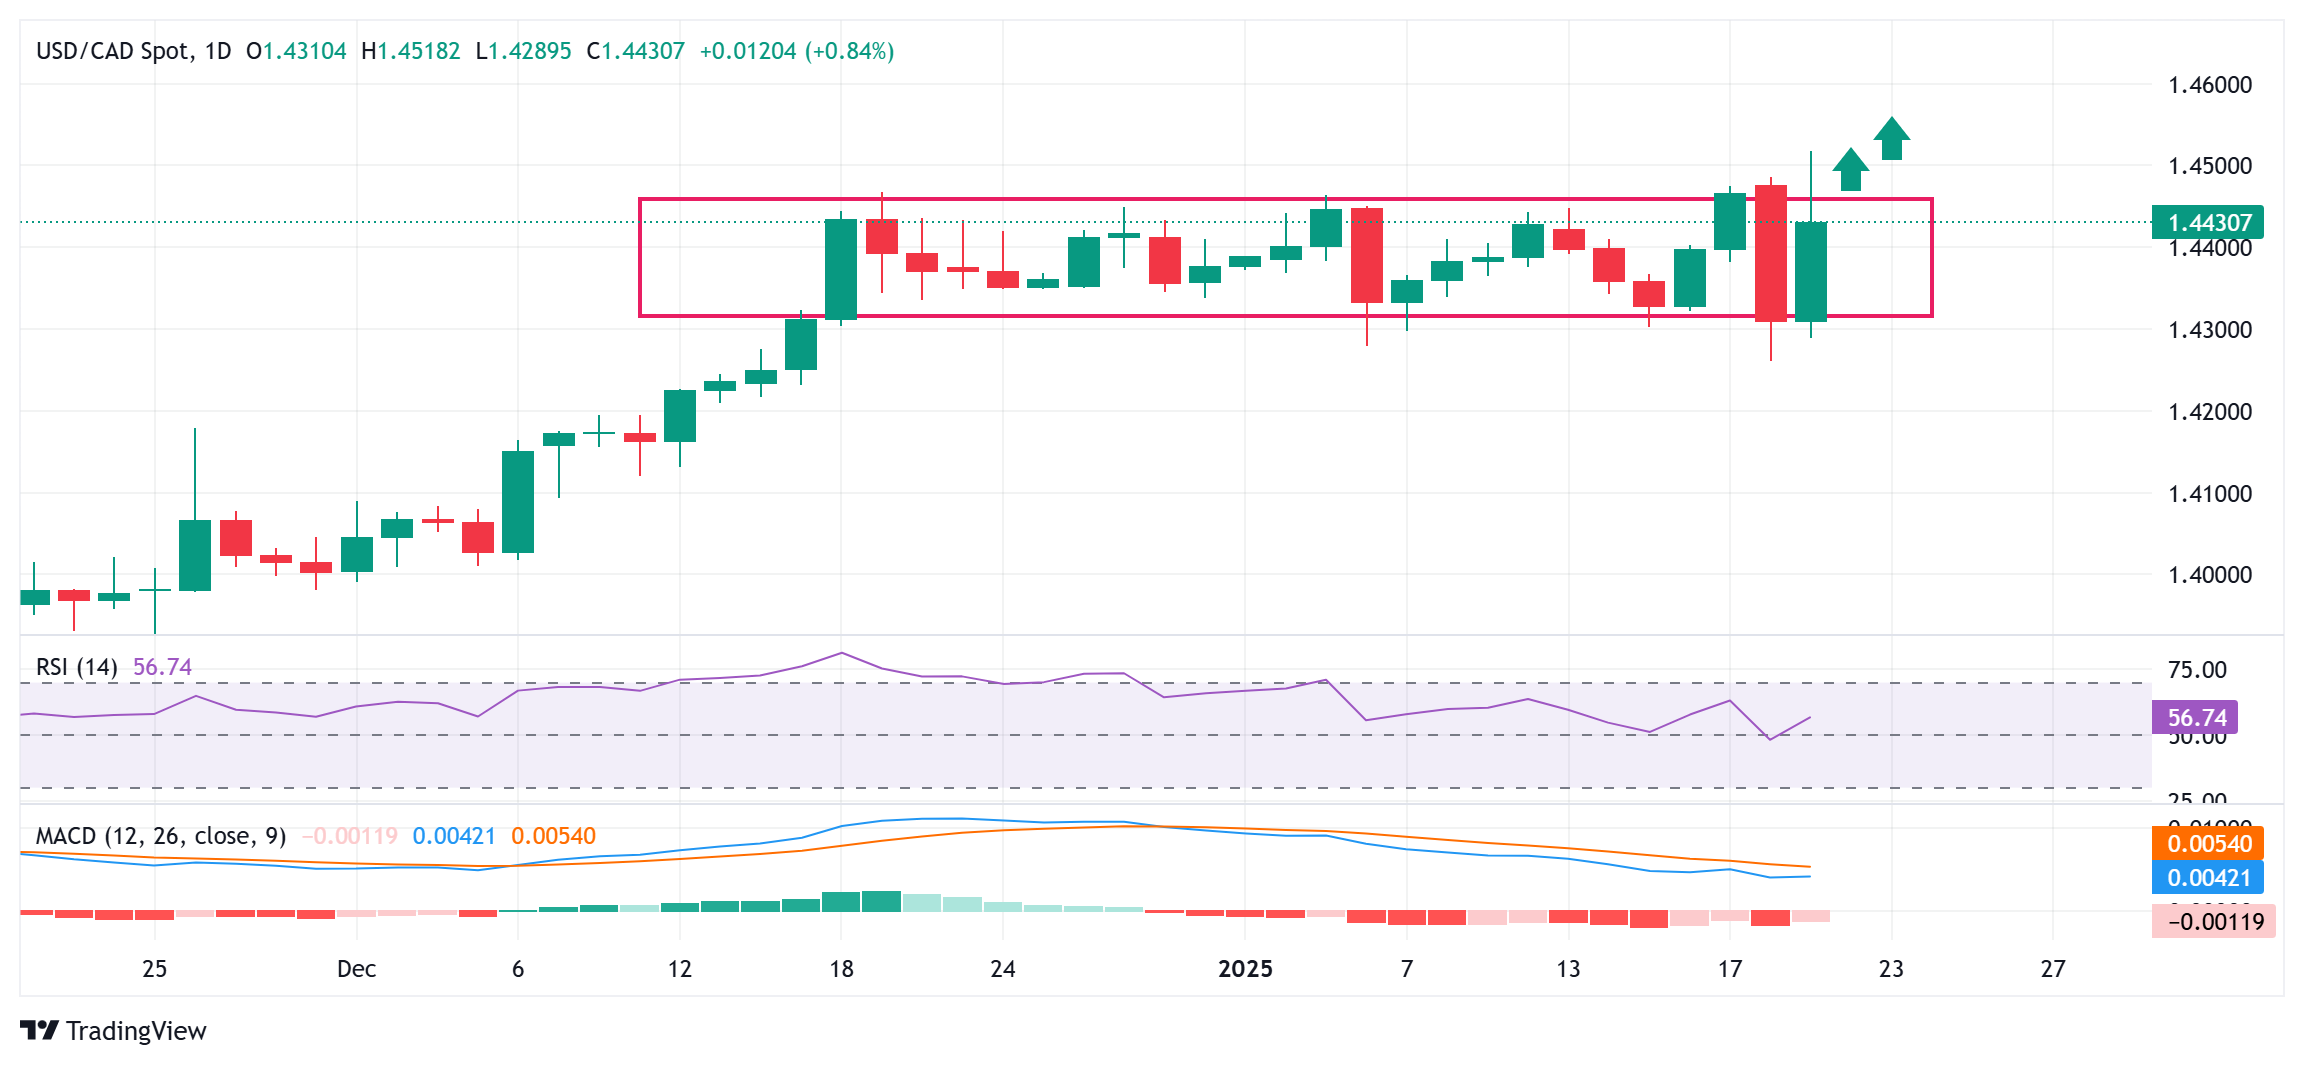
Technical Outlook
The USD/CAD pair has been oscillating in a familiar range over the past month or so. Against the backdrop of a strong move up from the September 2024 low, this might still be categorized as a bullish consolidation phase. Moreover, technical indicators on the daily chart – though have been losing positive traction – are still holding in positive territory. This further validates the near-term constructive outlook for the USD/CAD pair. That said, it will still be prudent to wait for sustained strength and acceptance above the 1.4465-1.4470 supply zone before positioning for further gains. This is followed by the 1.4500 psychological mark and the 1.4515 area, or a multi-year peak, above which spot prices might aim to conquer the 1.4600 round figure.
On the flip side, any subsequent pullback is likely to find decent support near the 1.4400 mark. A further slide could be seen as a buying opportunity near the 1.4335 region, which, in turn, should help limit the downside for the USD/CAD pair near the 1.4300 mark. This is followed by the monthly swing low, around the 1.4260 area. A convincing break below the latter could shift the bias in favor of bearish traders and pave the way for a deeper corrective decline.
Premium
You have reached your limit of 3 free articles for this month.
Start your subscription and get access to all our original articles.
Author

Haresh Menghani
FXStreet
Haresh Menghani is a detail-oriented professional with 10+ years of extensive experience in analysing the global financial markets.


