USD/CAD Price Annual Forecast: Development in rates policy divergence loom in 2024
- The Canadian Dollar put in a lot of miles just to end the year down two pennies.
- BoC, Fed rate policy lockstep at risk of rapid divergence in the first half of 2024.
- A breakdown of the Loonie-Oil correlation poised for a rough correction.

It was a back-and-forth year for the Canadian Dollar (CAD), kicking off 2023 with opening bids near 1.3550 against the US Dollar (USD), and the USD/CAD spent most of the year rattling between 1.3000 and 1.3900. The pair is set to wrap up December’s trading within sight of 2023’s opening bids, down around one and three-quarters of a percent on the year following a fourth-quarter breakout in the Canadian Dollar that surged over 4% from 12-month lows against the Greenback.
The USD/CAD will see diverging central bank policy as a key driver through 2024, and the correlation between the Canadian Dollar and Crude Oil is likely to hold firm through the upcoming trading year. Despite musings in recent years about a shakeout in the Loonie-Crude connection, 2023 saw USD/CAD and West Texas Intermediate (WTI) US Crude Oil moving around the charts in lockstep.
The Canadian economy is expected to run into headwinds through the second half of 2024, coinciding with a global growth slowdown that could hamper Crude Oil prices next year as fossil fuels demand flounders in low-growth or recessionary environments.
Rate hike cycle hits the ceiling, central banks agree the top is in
The Canadian Dollar spent most of 2023 grinding chart paper amidst familiar levels, wrapping up the year’s trading window within a penny of 2023’s opening bids. A limited rate differential between the Bank of Canada (BoC) and the US Federal Reserve (Fed) restrained long-term momentum in the USD/CAD for the majority of the year.
The BoC saw three rate increases this year, compared to the Fed’s four 25-basis-point rate hikes, with both central bank reference rates keeping in relative lockstep through the first half of 2023. Both central banks reached the peak of the rate hike cycle early in the third quarter, and the BoC and the Fed will close out 2023 with rates at 5.0% and 5.5%, respectively.
The BoC-Fed rate differential remained a close race through 2023, reaching its widest divergence of a relatively sedate three-quarters of a percent following the Fed’s third quarter-point hike in May.
After reaching a first-quarter high of 1.3862, the USD/CAD backslid into the 1.3100 handle by mid-July. A four-month rally kicked off to drag the pair into twelve-month highs just a few pips shy of the 1.3900 handle, before seeing broad-market weakness in the US Dollar that dragged the USD/CAD back towards 1.3300 to round out 2023’s frothy trading cycle.
The Canadian Dollar’s long-standing relationship with Crude Oil prices broke down in the second half of 2023, with the CAD rising against the US Dollar despite Crude Oil weakness that would normally be expected to drag down the Loonie. West Texas Intermediate (WTI) US Crude Oil barrels declined from a late September peak near $94.00 per barrel to a multi-month low around $70.00 per barrel in mid-December.
Crude Oil’s struggles in 2023 were highlighted by the Organization of the Petroleum Exporting Countries (OPEC) and its efforts to decisively cap off global Crude Oil production in the face of slumping global demand for fossil fuels. WTI plunged to 20-month lows near $64.30 in the second quarter before rallying to 13-month highs just shy of the $94.00 handle on broad-market expectations that OPEC’s drastic production cuts would see global oil supply undershoot energy demand heading through the back half of 2023.
Key member states within OPEC, specifically Saudi Arabia and Russia, dedicated themselves to 1.3 million bpd in production and exporting cuts, however Crude Oil’s tight-supply rally fizzled out heading into 2023’s third quarter. Drastically slowing Crude Oil demand from China, coupled with US Crude Oil reserves failing to draw down as much as energy markets expected, saw fossil markets rebalance their expectations of supply constraints in the future, sending Crude Oil back into familiar lows. Many of the smaller members of OPEC, including OPEC’s loose affiliation of non-OPEC ally states (OPEC+) have expressed dissatisfaction in OPEC’s current production targets, with many OPEC+ states relying on Crude Oil sales to balance their government budgets and keep their economies on the right side of the growth equation.
Despite adamant language from major OPEC states about clamping down on both oil production and exporting quotas, Crude Oil markets remained unconvinced that the oil cartel would be able to send Crude Oil production low enough to undercut barrel demand meaningfully. OPEC, lacking built-in policy tools to enforce production caps, has no formal mechanisms in place to punish or even prevent member states from flaunting export quotas. Even an exacerbation of the long-running conflict between Israel and Palestinian Hamas failed to reverse Crude Oil’s declines, despite flaring tensions in the Middle East and concerns about potential spillover into neighboring oil-heavy nations failing to materialize into any oil market interruptions.
Policy divergence and offloading hedge bets poised to kick CAD lower
With the Bank of Canada and Federal Reserve moving in lockstep on rates through 2023, 2024 sees a significant risk of policy divergence with the Canadian and US central banks overseeing increasingly diverging economies.
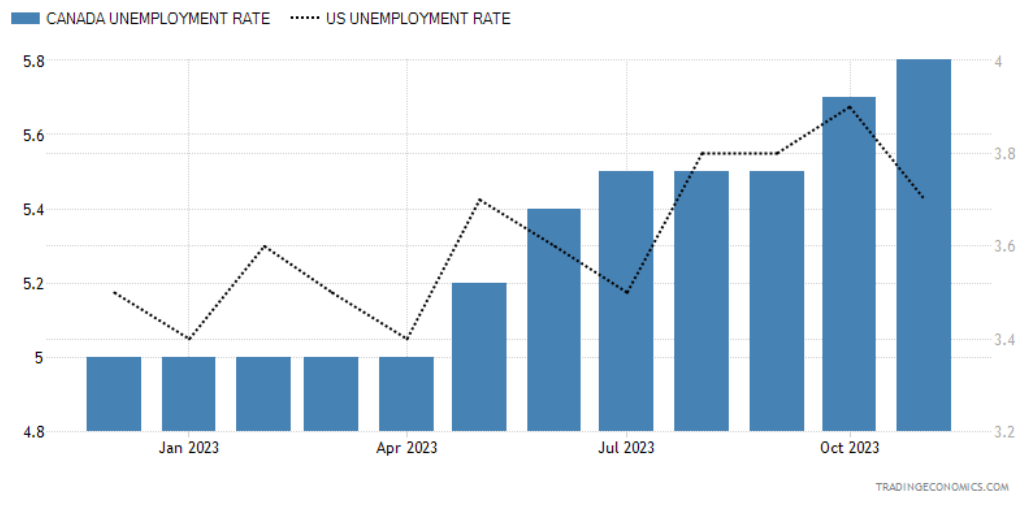
The US unemployment rate, while higher than it was this time last year, remains well below the structural level of unemployment, barely above 3.6% while the Canadian jobless rate continued to climb through 2023, approaching 6% at November’s print. US GDP growth remains relatively robust while Canada’s growth rate has ground to a halt, edging into negative territory in 2023’s fourth quarter.
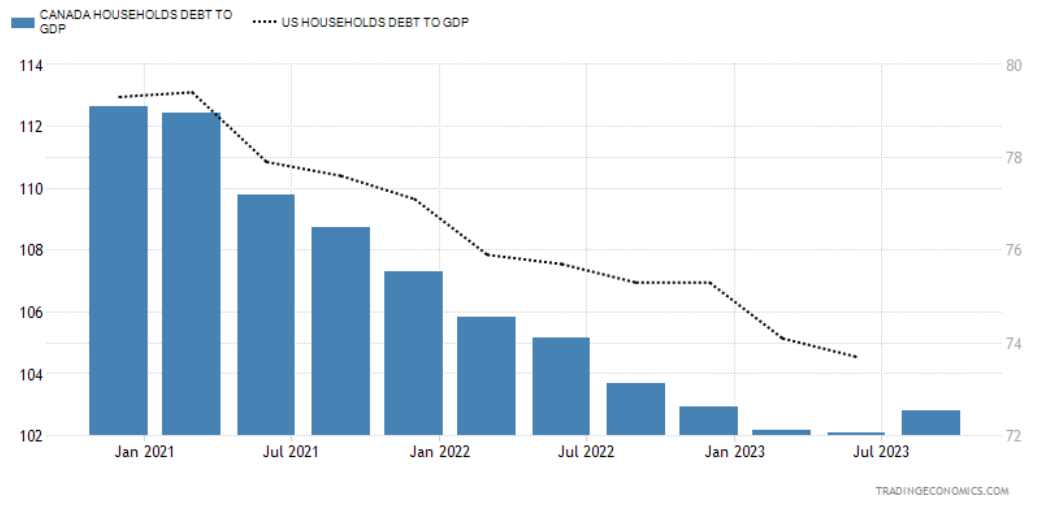
The US and Canada have both seen household debt as a ratio of GDP fall steadily in the past two years, but Canadian households remain exposed to economic downturn with consumer debt still measuring 103% of Canada’s GDP, compared to the US’ rate of private debt to GDP sinking below 74% in the second quarter of 2023.
With Canadian households grappling with a higher overall ratio of debt to economic growth, retail sales have been more sluggish compared to their US neighbors as a result. Canadian MoM retail sales tested negative territory during the second quarter and YoY retail sales struggled to hold over 2%, while US retail sales growth remains robust by comparison, rebounding to 4% YoY after a dip to the 2% region.
With Canada staring down the barrel of an early recession in the first half of 2024, the Bank of Canada is likely set to begin cutting rates well before the Federal Reserve. Despite market bets of a Fed rate cut cycle beginning as early as March, US Fed policymakers do not share money markets’ lofty expectations of early and frequent rate cuts. Diverging rate policies will weigh heavily on the CAD, as the latter half of 2023’s trading saw significant market flows structured around rate policy, given that the Loonie’s fourth-quarter rebound occurred despite declining Crude Oil over the same period.
The Canadian Dollar’s fourth-quarter rebound against the US Dollar coincides with a buildup of large speculators shorting the Canadian Dollar, reaching a multi-year peak and the highest amount of active short interest by large speculators and leveraged reported positions since 2017. As those large speculator positions begin to unwind, Canadian Dollar flows can be expected to reverse course and drag the Loonie lower. Large speculators on the Commitment of Traders (COT) report, which typically includes hedge funds and Commodity Trading Advisors (CTA), will traditionally amass inverse positions as they use currency bets as a hedge against exposure in other areas.
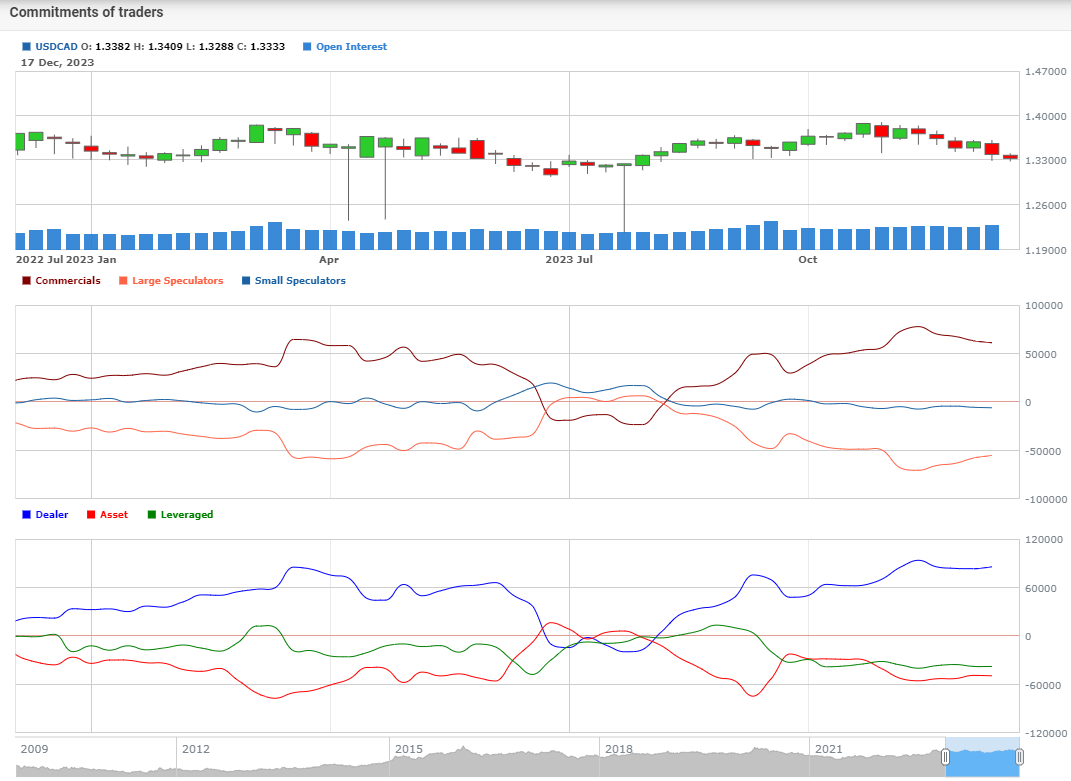
With speculative demand driving up the CAD in a break from the traditional Loonie-Oil correlation, and a large buildup of speculative positions poised for a reversal, 2024 is likely to see the CAD snap back to catch up with deflating Crude bids, rather than barrel prices rising amidst a global economic softening. OPEC’s efforts to purposefully undercut Crude Oil supply, despite early success in rattling market confidence, has seen minimal impact with US Crude Oil inventories rebounding to climb through the third and fourth quarters, albeit haltingly.
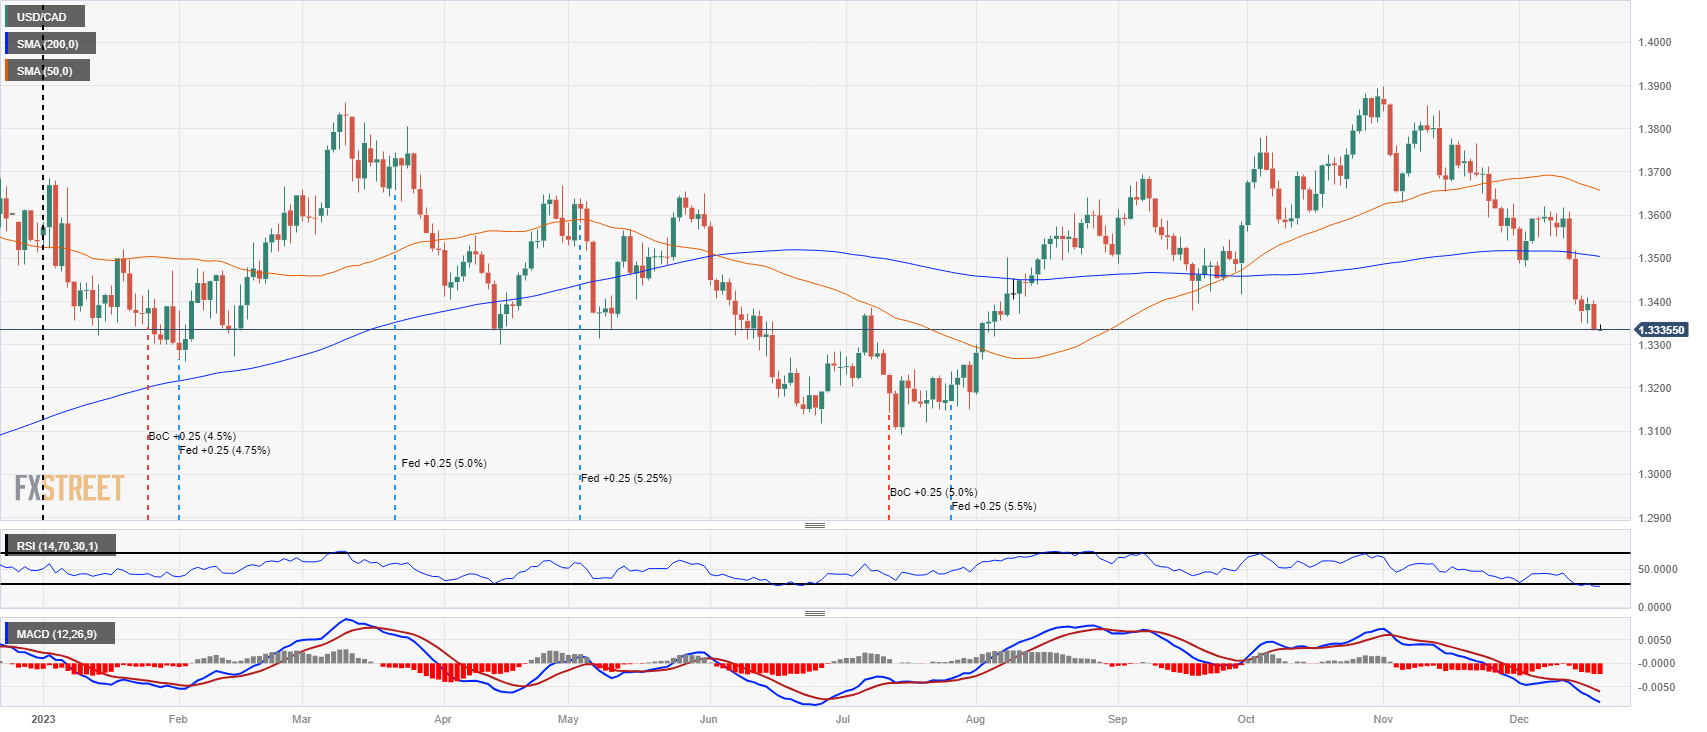
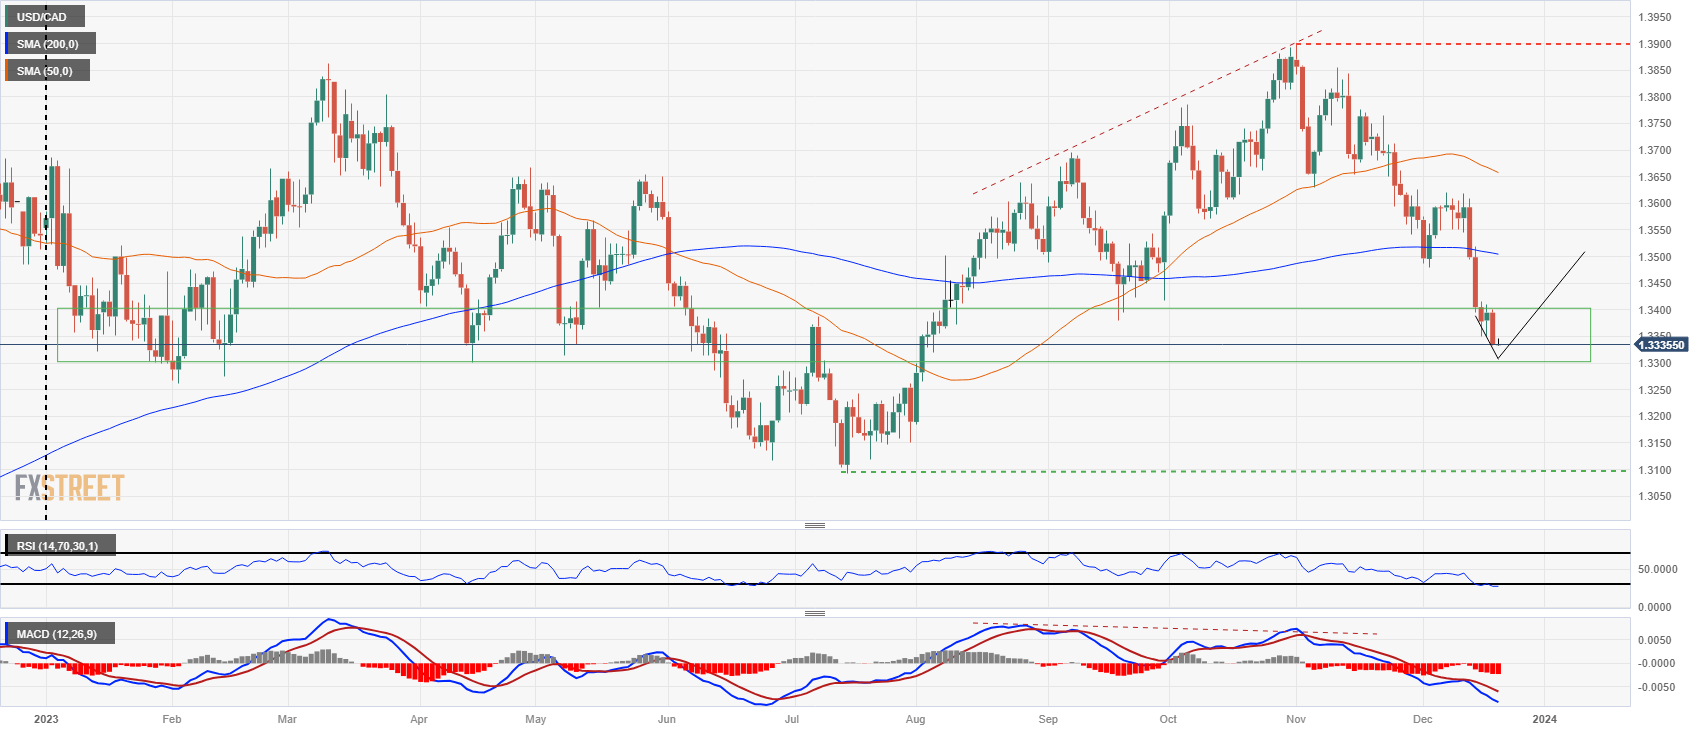
Technical Outlook: Long-term support near 1.3300 poised to kick-off another bull run in a confluence of market extremes
The USD/CAD’s cyclical trading pattern through 2023 saw plenty of opportunities for particularly brave traders with fast enough hands to catch falling knives at the extreme highs and lows of the pair’s trading range.
The 200-day Simple Moving Average (SMA) spent most of the year acting as a median price magnet rather than a hard technical barrier, keeping bids snared into the midrange and undercutting any potential long-run moves.
Keen-eyed indicator traders would have noted a bearish divergence in the Moving Average Convergence-Divergence (MACD) that solidified after the USD/CAD slipped from year-long highs just shy of the 1.3900 handle. With the MACD once again pinned in negative territory and the USD/CAD bottoming out at familiar technical support levels between 1.3300 and 1.3400, the pair could be primed for another pivot into a medium-term bullish pattern.
The Relative Strength Index (RSI) has also reverted to bullish signals after tumbling once more into the oversold region; the USD/CAD has rallied at least 2% bottom-to-top each time the indicator drops into buy flag conditions. Long signals from the RSI have been incredibly rare for the USD/CAD, only crossing the oversold barrier five times in the past two years, with the most recent seen on Friday, December 15.
With the USD/CAD steadily declining from early November’s peak bids near 1.3900, little remains in the way of technical short signals, and a downside break of the current support zone above 1.3300 will see the pair set to take a crack at 2023’s lows near 1.3100, provided broader markets continue to squeeze the US Dollar into the floorboards.
USD/CAD, Daily Chart, 2023
Summary: 2024 kick-off, in brief
2023’s comparatively quiet year in the charts, spurred by broad-market flows into and out of the US Dollar as investors grappled with Fed policy and BoC rate policy stuck in lockstep with Fed rate guidance, is set to give way to an interesting year as central bank policies see increasing risk of divergence with the Canadian economy accelerating into a recession in the first half of 2024.
The second half of 2023 saw a breakdown in the USD/CAD’s inverse correlation with Crude Oil prices as market behavior consolidated around US Dollar flows and a large imbalance of outsized leveraged hedge bets against the Canadian Dollar propping up the Loonie even as Crude Oil markets declined in the fourth quarter. A breakdown in the Loonie-oil correlation is much more likely to end with the CAD racing down to catch weak barrel bids than Crude Oil is to find the bidding power necessary to drive barrel costs meaningfully higher, especially as the multi-year hedge imbalance gets set to reverse flows.
Traders will want to keep a close ear to the ground for rumblings about policy shifts from the Bank of Canada, especially as economic datasets begin to shift lower in the first quarter of 2024.
(This story was corrected on December 22 at 12:38 GMT to say that OPEC made efforts to undercut Oil supply, not demand.)
Canadian Dollar price this year
The table below shows the percentage change of Canadian Dollar (CAD) against listed major currencies this year. Canadian Dollar was the strongest against the Japanese Yen.
| USD | EUR | GBP | CAD | AUD | JPY | NZD | CHF | |
| USD | -2.38% | -5.24% | -1.75% | 0.66% | 8.85% | 1.22% | -7.42% | |
| EUR | 2.33% | -3.21% | 1.00% | 3.31% | 10.97% | 3.71% | -5.14% | |
| GBP | 4.96% | 3.10% | 4.08% | 6.28% | 13.74% | 6.12% | -2.06% | |
| CAD | 1.73% | -1.01% | -3.38% | 2.30% | 10.42% | 2.16% | -5.57% | |
| AUD | -0.67% | -3.40% | -6.71% | -2.41% | 7.94% | 0.44% | -8.14% | |
| JPY | -9.71% | -12.33% | -15.46% | -11.20% | -8.62% | -8.80% | -18.23% | |
| NZD | -1.23% | -3.65% | -6.54% | -3.01% | -0.41% | 7.55% | -9.24% | |
| CHF | 6.69% | 4.93% | 2.08% | 5.89% | 7.54% | 15.37% | 8.04% |
The heat map shows percentage changes of major currencies against each other. The base currency is picked from the left column, while the quote currency is picked from the top row. For example, if you pick the Euro from the left column and move along the horizontal line to the Japanese Yen, the percentage change displayed in the box will represent EUR (base)/JPY (quote).
Canadian Dollar FAQs
What key factors drive the Canadian Dollar?
The key factors driving the Canadian Dollar (CAD) are the level of interest rates set by the Bank of Canada (BoC), the price of Oil, Canada’s largest export, the health of its economy, inflation and the Trade Balance, which is the difference between the value of Canada’s exports versus its imports. Other factors include market sentiment – whether investors are taking on more risky assets (risk-on) or seeking safe-havens (risk-off) – with risk-on being CAD-positive. As its largest trading partner, the health of the US economy is also a key factor influencing the Canadian Dollar.
How do the decisions of the Bank of Canada impact the Canadian Dollar?
The Bank of Canada (BoC) has a significant influence on the Canadian Dollar by setting the level of interest rates that banks can lend to one another. This influences the level of interest rates for everyone. The main goal of the BoC is to maintain inflation at 1-3% by adjusting interest rates up or down. Relatively higher interest rates tend to be positive for the CAD. The Bank of Canada can also use quantitative easing and tightening to influence credit conditions, with the former CAD-negative and the latter CAD-positive.
How does the price of Oil impact the Canadian Dollar?
The price of Oil is a key factor impacting the value of the Canadian Dollar. Petroleum is Canada’s biggest export, so Oil price tends to have an immediate impact on the CAD value. Generally, if Oil price rises CAD also goes up, as aggregate demand for the currency increases. The opposite is the case if the price of Oil falls. Higher Oil prices also tend to result in a greater likelihood of a positive Trade Balance, which is also supportive of the CAD.
How does inflation data impact the value of the Canadian Dollar?
While inflation had always traditionally been thought of as a negative factor for a currency since it lowers the value of money, the opposite has actually been the case in modern times with the relaxation of cross-border capital controls. Higher inflation tends to lead central banks to put up interest rates which attracts more capital inflows from global investors seeking a lucrative place to keep their money. This increases demand for the local currency, which in Canada’s case is the Canadian Dollar.
How does economic data influence the value of the Canadian Dollar?
Macroeconomic data releases gauge the health of the economy and can have an impact on the Canadian Dollar. Indicators such as GDP, Manufacturing and Services PMIs, employment, and consumer sentiment surveys can all influence the direction of the CAD. A strong economy is good for the Canadian Dollar. Not only does it attract more foreign investment but it may encourage the Bank of Canada to put up interest rates, leading to a stronger currency. If economic data is weak, however, the CAD is likely to fall.
Author

Joshua Gibson
FXStreet
Joshua joins the FXStreet team as an Economics and Finance double major from Vancouver Island University with twelve years' experience as an independent trader focusing on technical analysis.


