US Non-Farm Payrolls July Preview: A dual track labor market or imperfections in the data?
- Payrolls forecast to drop by two-thirds to 1.6 million.
- Unemployment to decrease to 10.5% from 11.1%, wages to fall.
- ADP report sows confusion with huge miss in July and even larger addition to June.
- Initial jobless claims stall for five weeks, ISM new orders soar.
- Equities on winning streak, dollar equivocates, credit stable.

It’s a confusing time for economists. Forecasts are in greater demand than ever but the data is often contradictory and sometimes plain wrong, making predictions particularly hazardous.
The US economy has shed over 20 million jobs since the pandemic began in March. Recovery depends on those people returning to work and normal life.
Non-farm payrolls have long been the standard reference for the labor market. But in the economic collapse of the shutdowns these once reliable figures have turned skittish. With the July numbers due and the economy facing a possible inflection point the statistical leads for NFP are more confusing than they have been in many years.
Non-farm payrolls are forecast to rise 1.6 million in July down from 4.8 million in June and 2.699 million in May. The unemployment rate (U-3) is expected to drop to 10.5% from 11.1% and the labor force participation rate to fall to 61.1% from 61.5%. Average hourly earnings should decrease 0.5% on the month in July and rise 4.2% annually following June's 1.2% drop and 5% gain. Average weekly hours may slip 0.1 to 34.4 in July. The underemployment rate (U-6) is projected to lift to 19.7% from 18.0%.
Let’s see if we can make sense of the contradictory data.
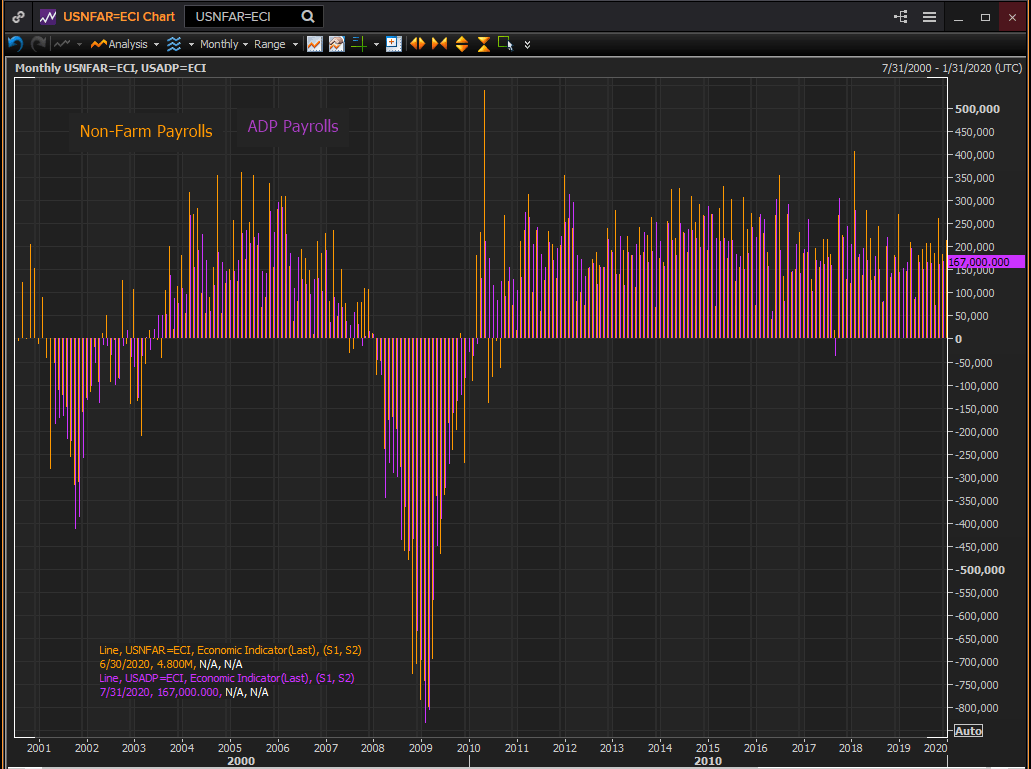
ADP and NFP
Private payrolls from Automatic Data Processing are a close indicator for the national employment figures from the Labor Department.
In July ADP payrolls were forecast to rise 1.5 million. Instead they gained just 167,000. The June figures, however, almost doubled on revision, jumping to 4.314 million from 2.369 million. The combined 2.112 million June adjustment and July payroll were more than a third higher than the July forecast.
These serious discrepancies between forecast and report and between initial figures and revisions have become commonplace.
As large numbers of people were returning to work in May analysts predicted ADP payrolls would shed 9 million jobs. The first ADP release had a loss of 2.76 million. One month later the revised May payrolls showed a 3.065 million gain, a swing of 5.825 million from the first release and an astonishing 14.065 miss on the initial -9 million projection.
The 3 million forecast for June was similar, going from a 0.631 million overestimate at the first report (2.369 initial release, 4.314 revision) to a 1.314 million underestimate at the second.
Payrolls from ADP are historically well correlated with the private payrolls from the Labor Department and with the overall non-farm figures. Discrepancies tended to be small and almost never of direction with one gaining and the other losing jobs. Nonetheless major variations have happened several times in the last ten years.
Forecasts for non-farm payrolls also have a checkered pandemic history. The May estimate was for a loss of 8 million positions. Payrolls actually rose 2.699 million. In June the estimate was 3 million, the actual figures was 4.8 million, 60% higher.
Given the difficulties and uncertainties of the current labor market the predictive assurance that would normally attach to the ADP figure is lacking. Not only is the correlation to NFP suspect but the internal accuracy of ADP has faltered badly in May and June, leaving July’s first result a questionable guide.
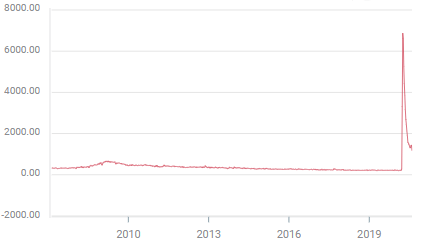
Initial and continuing claims
Claims peaked in the week of March 27 at 6.867 million. Over the next three months to June 26 they declined every week reaching 1.408 million on June 26, a 79% reduction. In the subsequent four weeks there was no improvement. The low of 1.307 million on July 10 was followed by two weeks of higher volume, 1.422 million on July 17 and 1.435 million on July 24. The July 31 week reversed trend with 1.186 million applicants. This was the lowest weekly total since the pandemic began and a surprise on the 1.415 million forecast. .
Initial jobless claims
The pattern for continuing claims is the same. The high of 24.912 million came on May 8 with a 35% decline to 16.151 million by July 10 and then a revised 16.951 million on July 17. The drop to 16.107 million for July 24 was unexpected as the forecast was 16.72 million.
Second wave and high frequency data
The rise in Covid cases in several Southern and Western states since the beginning of June prompted some tightening of business and social rules. The partial pullbacks in Texas, Florida and elsewhere combined with a number of states that have been slow to ease restrictions may have resulted in the stream of new layoffs and higher unemployment claims.
It is also possible and perhaps more likely that four months of non-existent or exceedingly slow sales have forced ever greater numbers of small businesses into bankruptcy, permanently ending employment for their workers. The small business failures that are keeping jobless claims elevated may have less to do with the June and July rise of Covid cases in a few states than the rolling failures as the consumer traffic fails to materialize in many places.
The longer consumption remains weak for small shops, restaurants, gyms and the like the more of these businessed will fail and the greater the number of employees will be thrown back onto jobless benefits.
Some high-frequency data, from credit cards, restaurants and travel bookings, seems to indicate that there has been a slackening of consumption in July after strong gains in June, though it is unclear how widespread, deep or continuous the slowdown has been.
The rise in initial claims from 1.307 million in the July 10 week to 1.434 million on July 24 is the only evidence that the July shift in high-frequency data had an impact on employment.
Business sentiment and Fed surveys improved in July
Sentiment and activity in the manufacturing and service sectors improved in July.
The ISM purchasing managers’ index for factories climbed to 54.2 from 52.6 in June, passing the 53.6 forecast. New orders jumped to 61.5, the highest reading since September 2018, from 56.4 in June and reversed the prediction for a drop to 46.8%. Only the employment index at 44.3, though an improvement from June’s 42.1, missed its 48.3 forecast and remained in contraction.
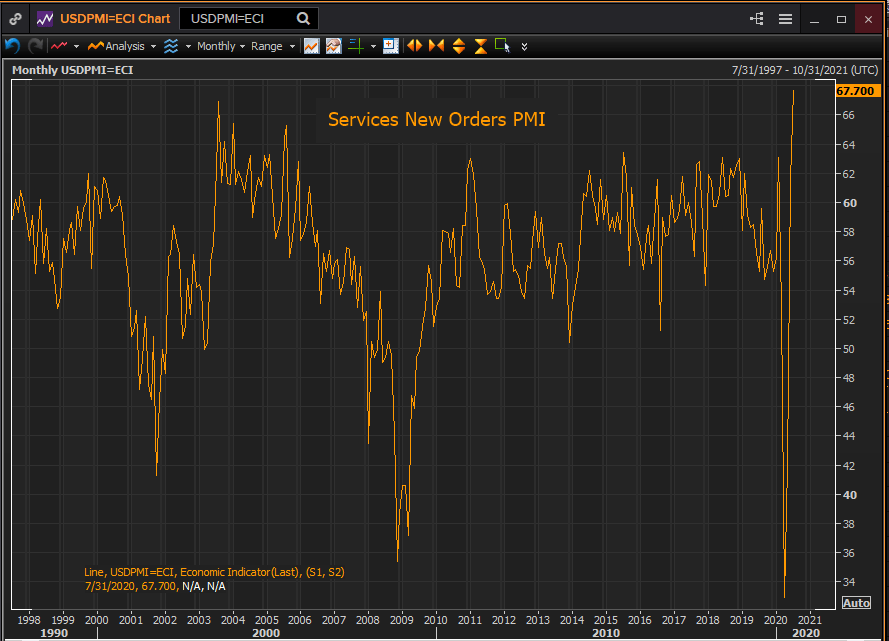
Service sentiment climbed to 58.1 in July from 57.1 in June. The consensus estimate had posited a drop to 55. New orders rose to 67.7 in July, an all-time record, from 61.6, beating the 64.7 forecast. Employment lagged, falling to 42.1 from 43.1 in June in a wide miss of the 51.1 projection.
Services New Orders PMI
Reuters
Survey indexes for regional manufacturing from the New York, Richmond and Kansas City Federal Reserve banks rose sharply in July. Only the Philadelphia index had a small decline, though it was better than forecast.
Conclusion and markets
The data for July is contradictory. Initial claims show a modest increase in mid-July then dropped to a pandemic low. Private payrolls from ADP collapsed last month but there is good reason to suspect the figures. Or to put it another way. What to believe, the July failure or the June success? Would the labor economy shut down so completely without government orders?
Purchasing managers’ indexes were robust in July. New orders were especially strong though employment indexes remain in contraction. Regional Fed manufacturing data for the month was good.
One possible explanation is that the initial claims and payrolls figures are reporting from two different labor markets.
The continuing layoffs that fuel the claims numbers come primarily from struggling and failing small businesses that cannot exist without consumer traffic, something still missing in many parts of the country.
Non-farm payrolls in contrast, represent the returning sales and hiring for the established businesses covered in the PMI figures. These are the firms producing the growth in GDP that the Atlanta Fed estimates is at 20.3% annualized in the third quarter.
Currency markets have punished the US dollar over the last three weeks expecting that the second wave of Covid cases would extract a large economic cost in the US. Traders have kept their heads down this week waiting for the Friday payroll numbers. Regardless of the state of jobless claims, if payrolls are good the dollar will rebound.
Equities are not buying the US Covid scenario. The S&P 500 rose for a fifth session on Thursday and is now just 1.3% from its February record. Treasury rates have edged down since the beginning of July. The 10-year closed at 0.536% on Thursday near the low of its post-pandemic range.
The initial claims figures are the primary evidence for the negative US scenario. Is that sufficient?
Perhaps a better question is can initial jobless claims and payrolls rise at the same time?
It would not be standard economics, but then nothing about the current situation is.
Author

Joseph Trevisani
FXStreet
Joseph Trevisani began his thirty-year career in the financial markets at Credit Suisse in New York and Singapore where he worked for 12 years as an interbank currency trader and trading desk manager.


