US Non-Farm Payrolls January Preview: Indications turn positive
- Payrolls forecast to be moderately higher in January, unemployment stable.
- ADP employment soared to 291,000 after December’s 199,000.
- Jobless claims at 211,750 continue near record run.

The Bureau of Labor Statistics (BLS) a division of the US Department of Labor will issue its Employment Situation Report for January on Friday, February 7th at 13:30 GMT, 8:30 EDT
Forecast
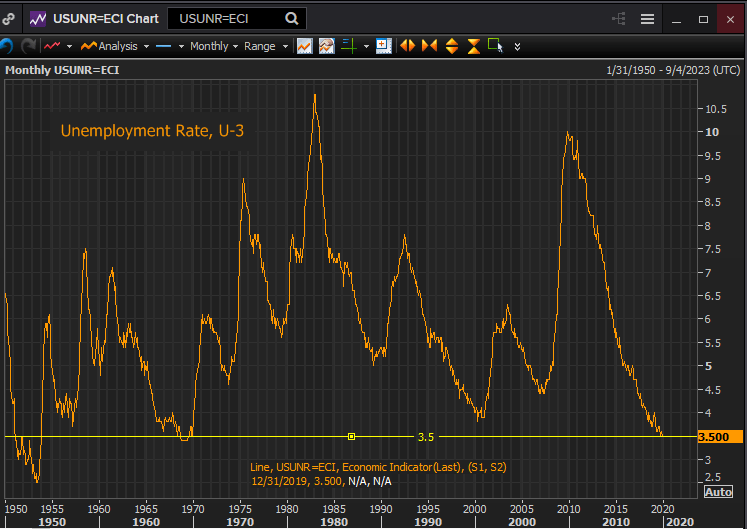
Non-farm payrolls are predicted to add 160,000 in January following December’s 145,000 increase. The unemployment rate is expected to be stable at 3.5%. Hourly earnings will rise 0.3% after December’s 0.1%. Annual earnings will be rise 3% following 2.9% prior. Labor force participation will drop 0.1% to 63.1%. Average weekly hours will be unchanged at 34.3.
The BLS Employment Situation Report
The Employment Situation Report from the Labor Department provides the broadest analysis of the US labor market. Commonly referenced as non-farm payrolls, NFP or payrolls for short, it is normally issued on the first Friday on every month covering the previous month’s information.
The report’s data is obtained from two surveys. The establishment survey polls a statistical sample of non-farm businesses and queries a number of employment and compensation related topics. These responses produce the payroll figures, wages, weekly hours, labor force participation rate and other statistics.
The household survey is briefer. It asks a statistical sample of US households if the non-military working age members are employed and if not when they last looked for a job. This information provides the basic data for the many BLS unemployment rates.
The unemployment rate most commonly used by analysts, economists and the media is the U-3 rate. This gauge limits the unemployed classification to non-working people who had actively sought work in the month prior to the survey. An individual who, though of age and not working, did not look for employment is not counted as being in the labor force and thus not counted as unemployed.
A second jobless measure, the U-6 or underemployment rate has a wider purview. It considers as unemployed any non-working individual who had searched for work in the prior year. This gauge is considered by many analysts to be a more accurate measure of joblessness and is normally several points higher than the U-3 rate.
Non-farm payrolls also includes each month an estimate for the number of jobs created by newly formed companies. As many of these concerns have not reported to the Federal government their employees are unrecorded. The BLS uses a modeling program, the oddly named birth–death model, to predict the number of new hires each month basing its figures on historical economic performance.
At the end of the year the BLS compares its estimates with tax and other government information and adjusts its numbers in accordance with facts. Revisions have often been 500,000 a year or more. In a normal year a quarter or more of non-farm payrolls can be lost or gained.
Payrolls are one of the most timely data sets its figures being a month old.
NFP and ADP
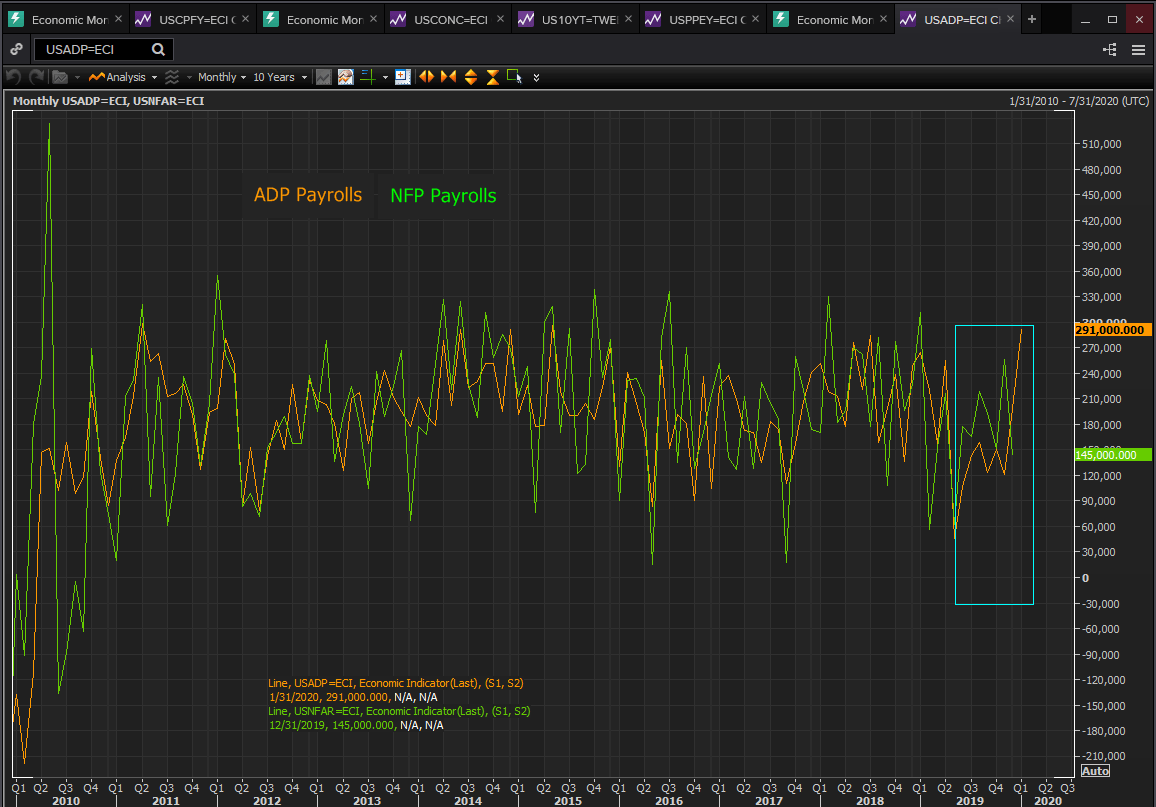
Trends in the two payroll statistics are closely related, though the monthly numbers occasionally diverge.
Reuters
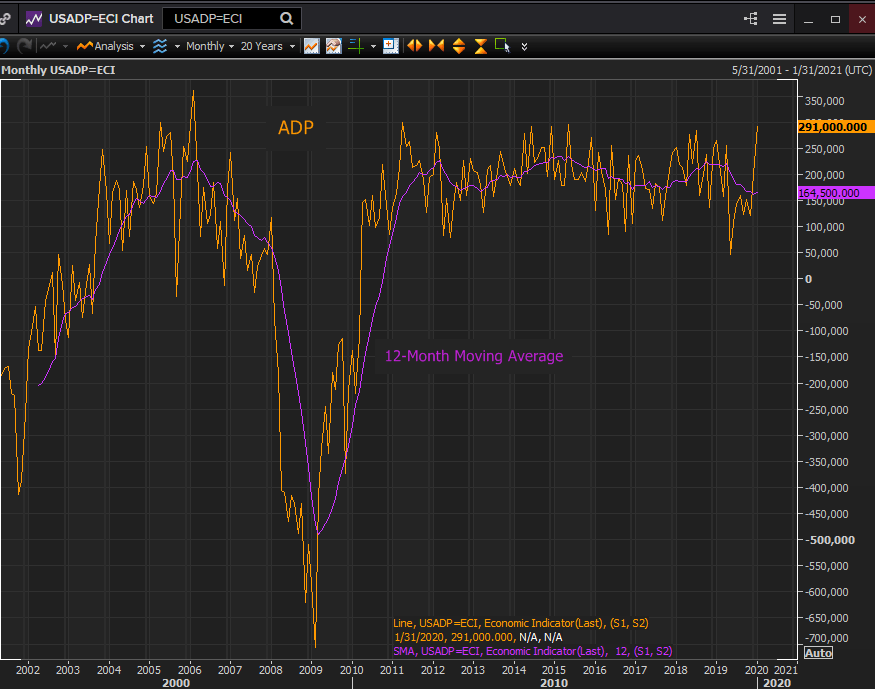
ADP has had two very strong months, 291,000 in January and 199,000 in December bringing the 3-month moving average to 205,000. The 12-month average peaked in April at 222,000 and was 165,000 in January.
Reuters
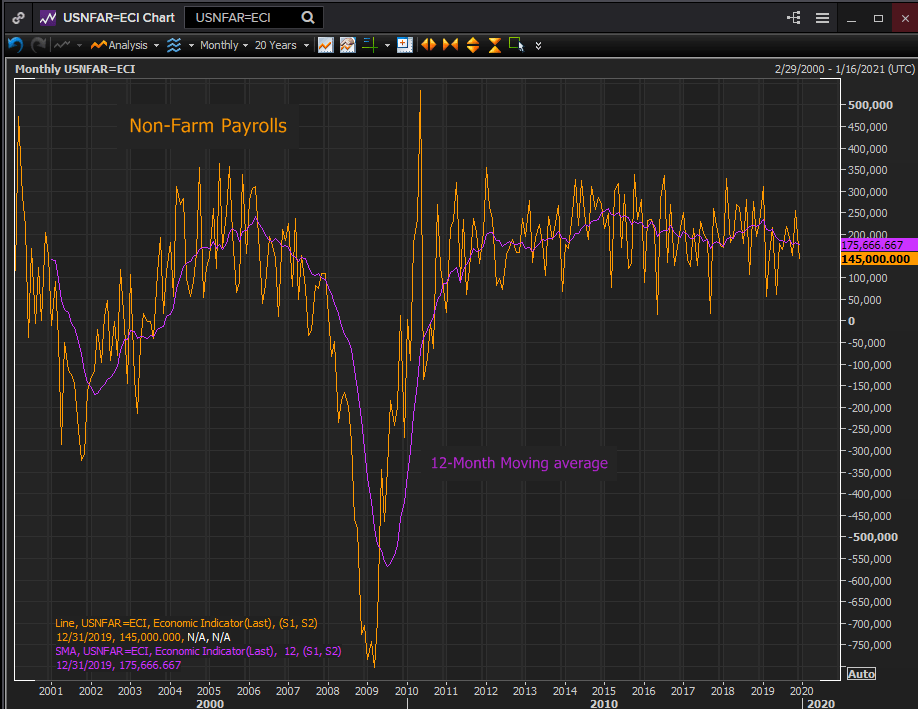
The NFP 12-month average matched the ADP decline in 2019 falling from 235,000 in January to 176,000 in December.
Reuters
A single month disparity between the two sets is common. Last year the ADP figures fell notably below trend three times but in only one month, May, was the drop matched in the NFP.
The continuation of December’s ADP payroll surge into and increasing in January is a much stronger signal for the job market than any individual month no matter how strong. If ADP’s private payrolls are seeing a growing demand for labor that trend should be duplicated in the national NFP figures.
Purchasing managers’ indexes
The recovery in the manufacturing PMI to 50.9 and expansion in January, the gain in the employment index and the jump in the new orders index are positive indications for the labor market.
Manufacturing PM
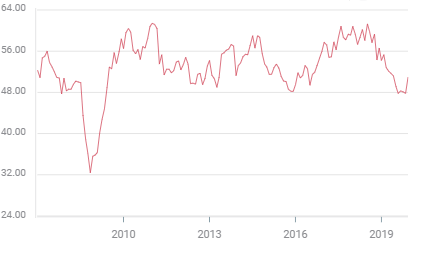
Sentiment in the service sector was not as deeply affected as the factory side with the overall index dropping to a low of 52.6 in September and recovering to a slightly better than expected 55.5 in January. The new orders index also rose in January and though it remains below the summer high of 59.6, the direction is positive. Likewise despite the unexpected drop in the employment index to 53.1 last month from 54.8 in December it is still expansionary.
Manufacturing is considered the more forward looking of the two sectors due to the longer lead times for factory production. It was new manufacturing employment that crashed in 2019 to 46,000 from 264,000 in 2018. If the outlook among shop managers is improving, the effect will soon, if not immediately be felt in employment.
Initial jobless claims
Claims have returned to their near 50-year nadir at 211,750 in the four-week moving average for the final week of January after jumping almost 20,000 to 233,500 in the last week of December.
As has been true for most of the past year these levels in claims are a powerful indication that labor market remains in robust health.
Conclusion and the dollar
All indications are for a good if not exceptional January payroll number. The ADP increase has been strong for two months, manufacturing and services business sentiment have improved and jobless claims and the unemployment rate offer no hint of trouble.
Reuters
American economic growth was steady through the last three quarters and, though it is early in the series, the Atlanta Fed’s current estimate for the first quarter is 2.9%. With economic activity and business sentiment rising, consumer spending steady and wages well ahead of inflation, the logic for a contraction in the pace of new hiring is lacking.
The US-China trade deal, though partially overshadowed by the corona virus, and its potential effect remains the background economic scenario for the US economy and the dollar. It has long been anticipated that the pact would prompt higher growth in the US and China and in particular would end the American drought of business investment and new factory employment.
With the Fed and other major central banks at neutral currency comparisons will, as the old phrase goes, have to be earned. The dollar should begin banking its wages shortly.
Author

Joseph Trevisani
FXStreet
Joseph Trevisani began his thirty-year career in the financial markets at Credit Suisse in New York and Singapore where he worked for 12 years as an interbank currency trader and trading desk manager.