US Dollar Index defends its growth thesis – Will it pass with honors?
The USDX rose above its inverse H&S pattern neckline. After months-long preparation, is it ready to take its final test… and shine?
The US Dollar Index (USDX)
With investors putting the USD Index through a rigorous exam last week (ending Jul. 23), months of study helped the greenback pass the test with flying colors. Case in point: with the USD Index rising above the neckline of its inverse (bullish) head & shoulders pattern, the head implies a medium-term target of roughly 98. On top of that, with the USD Index’s textbook validation adding to the bullish momentum last week – with the greenback verifying its recent breakout and responding with further strength – the U.S. dollar is likely to graduate with honors in the coming months.
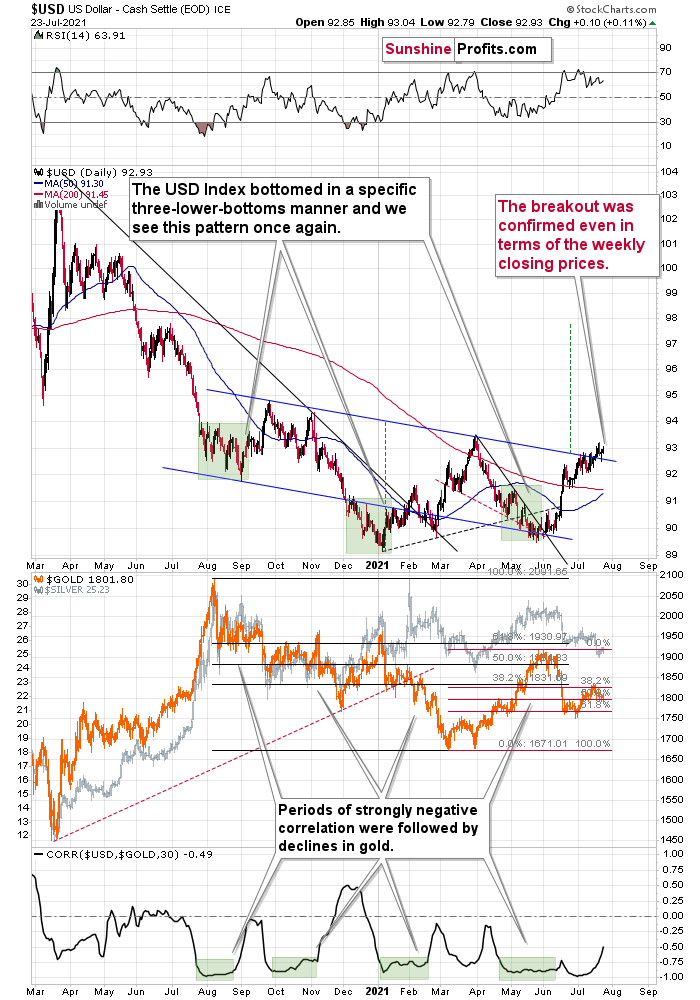
What’s more, the bullish breakout was further validated when the USD Index closed the week above the neck level of its H&S pattern, and it’s difficult to imagine a more sanguine sign for the U.S. dollar. Thus, with the greenback poised to move sharply higher in the coming weeks, gold, silver and mining stocks are likely to head in the opposite direction.
In addition, the USD Index often sizzles in the summer sun. To explain, major USDX rallies often start during the middle of the year, and with the dollar’s bullish IQ often rising with the temperature, gold, silver and mining stocks will likely feel the heat over the medium term.
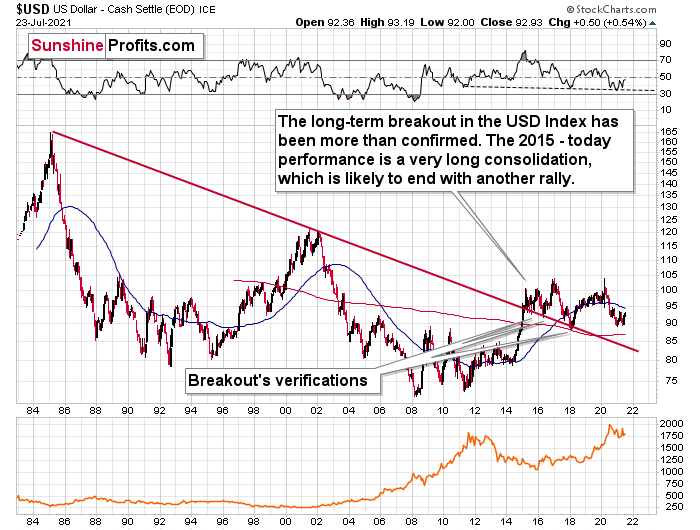
If you analyze the chart below, you can see that summertime surges have been mainstays on the USD Index’s historical record and double bottoms often signal the end of major declines or ignite significant rallies. For example, in 2004, 2005, 2008, 2011, 2014 and 2018, a retest of the lows (or close to them) occurred before the USD Index began its upward flights. In addition, back in 2008, U.S. equities’ plight added even more wind to the USD Index’s sails. And if the general stock market suffers another profound decline (along with gold miners and silver), a sharp re-rating of the USDX is likely in the cards.

On top of that, the eye in the sky doesn’t lie. And with the USDX’s long-term breakout clearly visible, the smart money is already backing the greenback.
As further evidence, the latest Commitments of Traders (COT) report shows that non-commercial (speculative) futures traders have increased their long exposure to the U.S. dollar (the light blue line below). More importantly, though, with longs bouncing off a roughly 10-year low and the current positioning still well below the highs set in previous years, the U.S. dollar still has plenty of room to run.
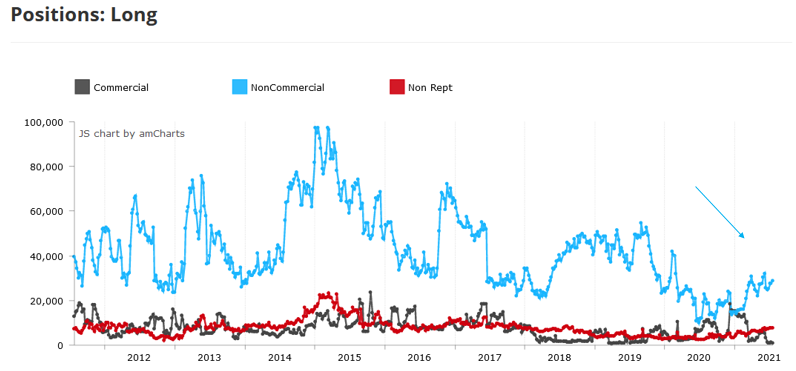
Source: COT
Finally, as the polar opposite of the USD Index, the Euro Index’s recent symmetrical decline mirrors the drawdown that we witnessed in mid-2020. And while the breakdown below the neckline of its bearish head & shoulders pattern still requires further verification, a continuation of the trend could usher the index back to the June 2020 lows or even lower. For context, the EUR/USD accounts for nearly 58% of the movement of the USD Index.
In addition, when the Euro Index reached the neckline of its bearish H&S pattern in early April 2021, late September 2020, and late October 2020, a fierce rally ensued. However, this time around, the corrective upswing has been extremely weak. As a result, with lower highs and lower lows plaguing the Euro Index in recent weeks, it’s likely only a matter of time before the neckline officially breaks.
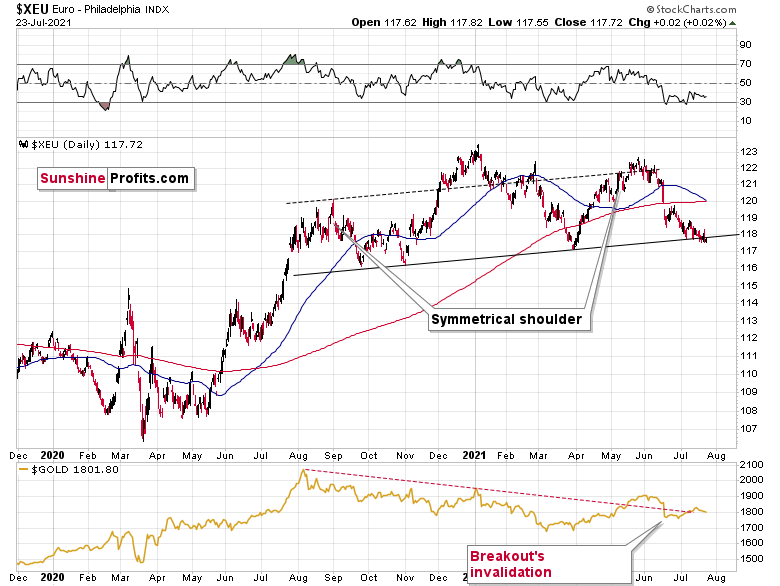
Even more relevant, the completion of the masterpiece could have a profound impact on gold, silver and mining stocks. To explain, gold continues to underperform the euro. If you analyze the bottom half of the chart above, you can see that material upswings in the Euro Index have resulted in diminishing marginal returns for the yellow metal. Thus, the relative weakness is an ominous sign. That’s another point for the bearish price prediction for gold.
The bottom line?
Once the momentum unfolds, ~94.5 is likely the USD Index’s first stop, ~98 is likely the next stop, and the USDX will likely exceed 100 at some point over the medium or long term. Keep in mind though: we’re not bullish on the greenback because of the U.S.’ absolute outperformance. It’s because the region is fundamentally outperforming the Eurozone, and the relative performance is what really matters.
In conclusion, the USD Index will likely emerge victorious in this epic battle of wits. Moreover, with the GDXJ ETF (our short position) avoiding mirroring gold’s recent strength, it seems that when the USDX finally does rally profoundly, junior mining stocks will fall substantially. However, following a profound climax, gold, silver and mining stocks will likely resume their secular uptrends.
Want free follow-ups to the above article and details not available to 99%+ investors? Sign up to our free newsletter today!
Want free follow-ups to the above article and details not available to 99%+ investors? Sign up to our free newsletter today!
Author

Przemyslaw Radomski, CFA
Sunshine Profits
Przemyslaw Radomski, CFA (PR) is a precious metals investor and analyst who takes advantage of the emotionality on the markets, and invites you to do the same. His company, Sunshine Profits, publishes analytical software that any


