SportsWear Market Analysis

When people talk about Sportswear , you will always hear either Nike or Adidas as they are the most used brands in the world despite other known names like Puma , Asics or Converse . Nike established it self as the world’s leading innovator in sports related footwear, clothing, tools and accessories beating Adidas which is the largest sportswear manufacturer in the European Continent . However in 2014 , Under Armour ( American sports clothing and accessories company ) managed to surpassed Adidas by U.S. sales to claim the No. 2 spot in the sportswear market behind Nike which put a lot of pressure on Adidas that finally managed last year to reclaim it’s second spot in U.S with impressive gains in sales and operating profit .

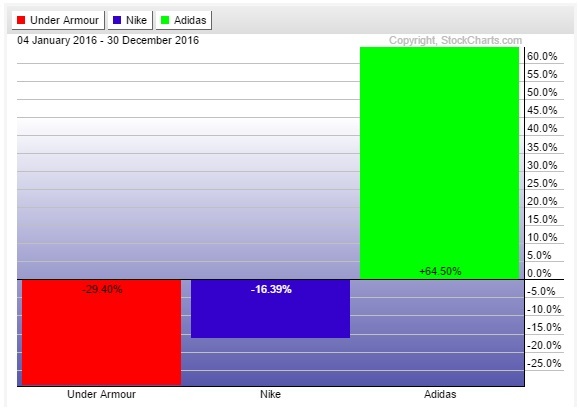
The leader Nike (NYSE: NKE) and the new challenger Under Armour (NYSE:UAA) had a rough 2016, at least in terms of share price performance compared to Adidas (NASDAQOTH:ADDYY) which managed to close at +64.5% . Nike down -16% is the Dow’s worst performer for last year and Under Armour closing at -30% was its worst 1 year decline so what can we expect from these companies for the coming year 2017 and which one is better for investing ?

Elliot

Nike & Adidas has always been far larger companies than Under Armour , but the move to the top-list putt the young company under the spotlight with a lot of expectation . During 2016 , the company managed to sign huge agreement & contract with NCAA , MLB & NASL which will boost the company for the next 10 to 15 years so despite a disappointing performance , Under Armour remains on track to reach its goal of $7.5 billion in sales by 2018 which represent annualized growth of about 23.5% putting it ahead of Nike & Adidas . Consequently I’m favoring UAA for a stronger recovery and better performance for the coming years and to confirm this view we need to take a look at the technical picture .

Under Armour ( UAA ) Elliott Wave Analysis

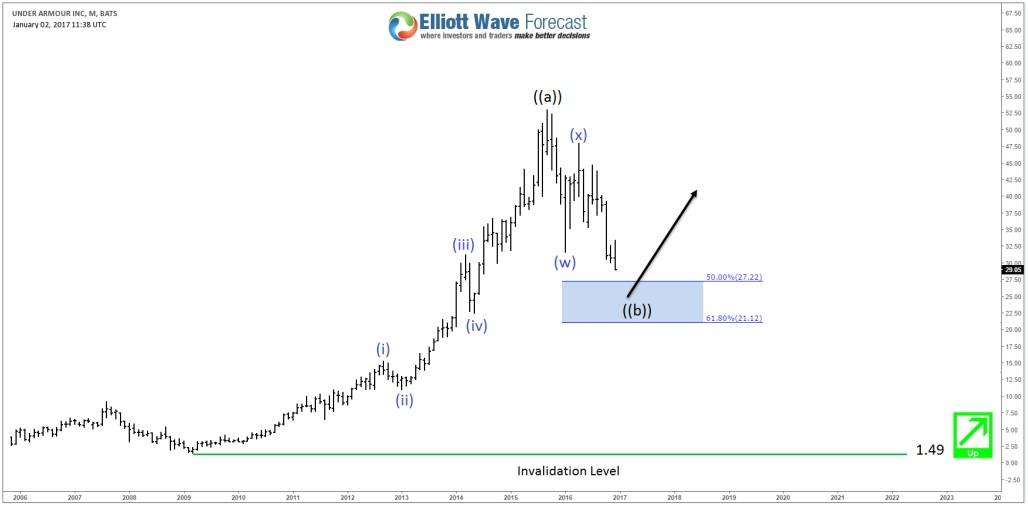
The monthly chart is showing that UAA is still correcting the cycle from 2009 low and currently doing a double three correction ( WXY ) from the peak explaining the poor performance in the last 2 years . The pullback can still reach 50%-61.8% area of the rally around $27.22 – $21.12 , so unless the company goes broke , the stock should at least bounce in 3 waves against 2015 peak if not resuming the bullish trend for new highs .

Elliot

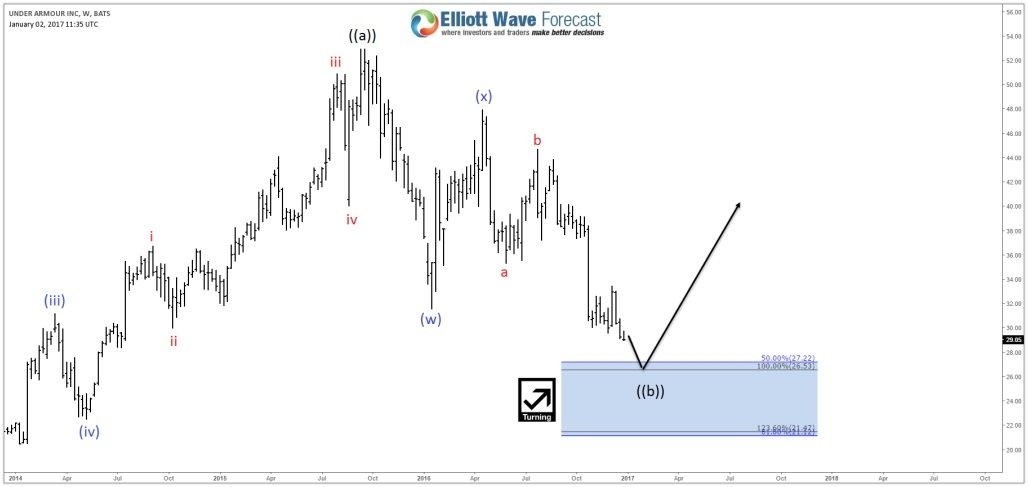
The tricky part about the correction is that it can take many different form of structures . In this case the equal legs area from the peak coming at $26.53 – $21.42 could either end the whole correction from the 2015 peak or just bounce in the second connector wave (x) against last year peak before doing another leg lower as a triple three ( WXYZ ) . But in both cases a bounce is expected to happen from the inflection area.

Elliot

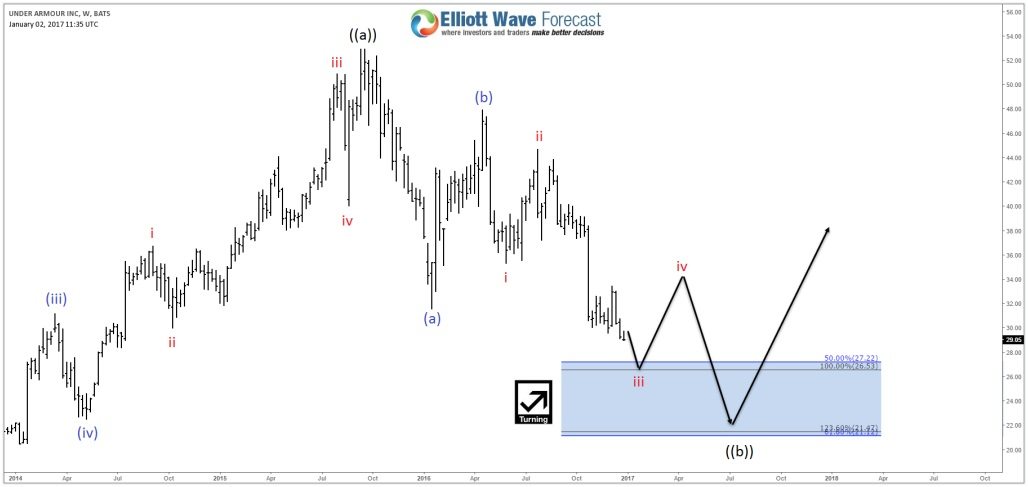
An alternative scenario is proposing that UAA could be doing a Flat from 2015 peak and currently is only ending wave iii of (c) which mean the coming bounce won’t be that strong as the stock still need another 5th leg lower before ending wave ((b)) when the larger bounce should happen.

Elliot

Recap

Having a negative year in the stock market doesn’t necessary mean that the company is doomed as healthy corrections happens all the time which is how the market works .  So the Sportswear sector will keep growing each year with the giants Nike & Adidas leading the pack but Under Armour is ready to make the big move so it’s better to watch it closely as the company has a better growth prospects in the coming years .

Elliot

If you enjoyed this post, feel free to read other articles at our Technical Blog and also check our Chart of The Day . For further information on how to trade forex, indices, commodities and stocks using Elliott Wave technique ,  try us 14 days for FREE . You will get access to our Professional Elliott Wave analysis in 4 different time frames, Daily Elliott Wave Setup Videos , Live Trading Room and 2 Live Analysis Session done by our Expert Analysts every day, 24 hour chat room support, Weekly Technical videos and much more so if you are not a member yet, use this opportunity and sign up to get your FREE trial .

FURTHER DISCLOSURES AND DISCLAIMER CONCERNING RISK, RESPONSIBILITY AND LIABILITY Trading in the Foreign Exchange market is a challenging opportunity where above average returns are available for educated and experienced investors who are willing to take above average risk. However, before deciding to participate in Foreign Exchange (FX) trading, you should carefully consider your investment objectives, level of xperience and risk appetite. Do not invest or trade capital you cannot afford to lose. EME PROCESSING AND CONSULTING, LLC, THEIR REPRESENTATIVES, AND ANYONE WORKING FOR OR WITHIN WWW.ELLIOTTWAVE- FORECAST.COM is not responsible for any loss from any form of distributed advice, signal, analysis, or content. Again, we fully DISCLOSE to the Subscriber base that the Service as a whole, the individual Parties, Representatives, or owners shall not be liable to any and all Subscribers for any losses or damages as a result of any action taken by the Subscriber from any trade idea or signal posted on the website(s) distributed through any form of social-media, email, the website, and/or any other electronic, written, verbal, or future form of communication . All analysis, trading signals, trading recommendations, all charts, communicated interpretations of the wave counts, and all content from any media form produced by www.Elliottwave-forecast.com and/or the Representatives are solely the opinions and best efforts of the respective author(s). In general Forex instruments are highly leveraged, and traders can lose some or all of their initial margin funds. All content provided by www.Elliottwave-forecast.com is expressed in good faith and is intended to help Subscribers succeed in the marketplace, but it is never guaranteed. There is no “holy grail” to trading or forecasting the market and we are wrong sometimes like everyone else. Please understand and accept the risk involved when making any trading and/or investment decision. UNDERSTAND that all the content we provide is protected through copyright of EME PROCESSING AND CONSULTING, LLC. It is illegal to disseminate in any form of communication any part or all of our proprietary information without specific authorization. UNDERSTAND that you also agree to not allow persons that are not PAID SUBSCRIBERS to view any of the content not released publicly. IF YOU ARE FOUND TO BE IN VIOLATION OF THESE RESTRICTIONS you or your firm (as the Subscriber) will be charged fully with no discount for one year subscription to our Premium Plus Plan at $1,799.88 for EACH person or firm who received any of our content illegally through the respected intermediary’s (Subscriber in violation of terms) channel(s) of communication.

Recommended Content


Recommended Content

Editors’ Picks

EUR/USD trades with negative bias, holds above 1.0700 as traders await US PCE Price Index

EUR/USD trades with negative bias, holds above 1.0700 as traders await US PCE Price Index

EUR/USD edges lower during the Asian session on Friday and moves away from a two-week high, around the 1.0740 area touched the previous day. Spot prices trade around the 1.0725-1.0720 region and remain at the mercy of the US Dollar price dynamics ahead of the crucial US data.

EUR/USD News

USD/JPY jumps above 156.00 on BoJ's steady policy

USD/JPY jumps above 156.00 on BoJ's steady policy

USD/JPY has come under intense buying pressure, surging past 156.00 after the Bank of Japan kept the key rate unchanged but tweaked its policy statement. The BoJ maintained its fiscal year 2024 and 2025 core inflation forecasts, disappointing the Japanese Yen buyers. 

USD/JPY News

Gold price flatlines as traders look to US PCE Price Index for some meaningful impetus

Gold price flatlines as traders look to US PCE Price Index for some meaningful impetus

Gold price lacks any firm intraday direction and is influenced by a combination of diverging forces. The weaker US GDP print and a rise in US inflation benefit the metal amid subdued USD demand. Hawkish Fed expectations cap the upside as traders await the release of the US PCE Price Index.

Gold News

Sei Price Prediction: SEI is in the zone of interest after a 10% leap

Sei Price Prediction: SEI is in the zone of interest after a 10% leap

Sei price has been in recovery mode for almost ten days now, following a fall of almost 65% beginning in mid-March. While the SEI bulls continue to show strength, the uptrend could prove premature as massive bearish sentiment hovers above the altcoin’s price.

Read more

US core PCE inflation set to signal firm price pressures as markets delay Federal Reserve rate cut bets

US core PCE inflation set to signal firm price pressures as markets delay Federal Reserve rate cut bets

The core PCE Price Index, which excludes volatile food and energy prices, is seen as the more influential measure of inflation in terms of Fed positioning. The index is forecast to rise 0.3% on a monthly basis in March, matching February’s increase. 

Read more

Majors

Cryptocurrencies

Signatures