Trump “Dump” and Brexit Take their Toll
Good Morning Traders,
As of this writing 4:05 AM EST, here’s what we see:
US Dollar: Mar. USD is Up at 100.580.
Energies: February Crude is Up at 53.46.
Financials: The Mar 30 year bond is Down 12 ticks and trading at 152.30.
Indices: The March S&P 500 emini ES contract is 9 ticks Higher and trading at 2265.00.
Gold: The February gold contract is trading Down at 1213.00. Gold is 9 ticks Lower than its close.
Initial Conclusion
This is not a correlated market. The dollar is Up+ and crude is Up+ which is not normal but the 30 year bond is trading Down-. The Financials should always correlate with the US dollar such that if the dollar is lower then bonds should follow and vice-versa. The indices are Up+ and Crude is trading Up+ which is not correlated. Gold is trading Down which is correlated with the US dollar trading Up. I tend to believe that Gold has an inverse relationship with the US Dollar as when the US Dollar is down, Gold tends to rise in value and vice-versa. Think of it as a seesaw, when one is up the other should be down. I point this out to you to make you aware that when we don’t have a correlated market, it means something is wrong. As traders you need to be aware of this and proceed with your eyes wide open.
Asia traded mainly higher with the exception of the Singapore exchange which traded lower. As of this writing Europe is trading mixed with half the exchanges higher and the other half lower.
Possible Challenges To Traders Today
– CPI m/m is out at 8:30 AM. This is major.
– Core CPI is out at 8:30 AM EST. This is major.
– Capacity Utilization Rate is out at 9:15 AM EST. This is major.
– Industrial Production m/m at 9:15 AM EST. This is major.
– NAHB Housing Market Index is out at 10 AM. This is major.
– FOMC Member Kashkari Speaks at 11 AM EST. This is major.
– Beige Book is out at 2 PM EST. This is major.
– Fed Chair Yellen Speaks at 3 PM EST. This is major.
– TIC Long-Term Purchases is out at 4 PM. This is not major.
Treasuries
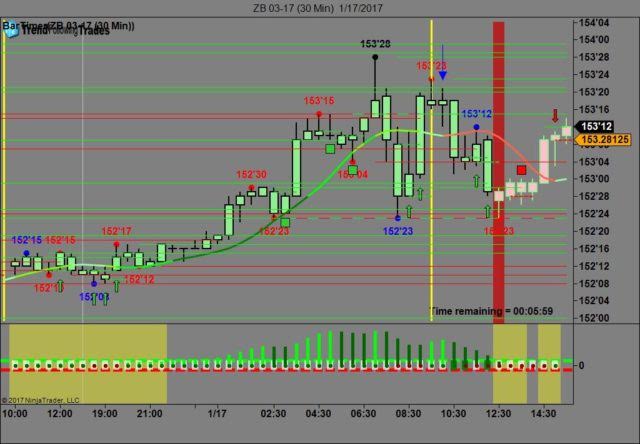
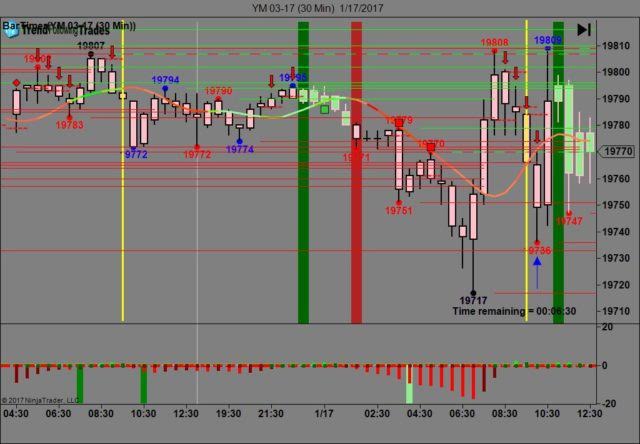
We’ve elected to switch gears a bit and show correlation between the 30 year bond (ZB) and The YM futures contract. The YM contract is the DJIA and the purpose is to show reverse correlation between the two instruments. Remember it’s liken to a seesaw, when up goes up the other should go down and vice versa.
Yesterday the ZB made it’s move at around 10 AM EST with no real economic news in sight. The ZB hit a high at around that time and the YM hit a low. If you look at the charts below ZB gave a signal at around 10 AM EST and the YM was moving higher at the same time. Look at the charts below and you’ll see a pattern for both assets. ZB hit a high at around 10 AM EST and the YM hit a low. These charts represent the newest version of Trend Following Trades and I’ve changed the timeframe to a 30 minute chart to display better. This represented a shorting opportunity on the 30 year bond, as a trader you could have netted about 30 plus ticks per contract on this trade. Each tick is worth $31.25. We added a Donchian Channel to the charts to show the signals more clearly. Charts Courtesy of Trend Following Trades built on a NinjaTrader platform Click on an image to enlarge it.
Bias
Yesterday we gave the markets a downside bias as both the Bonds and Gold were both trading higher and this doesn’t bode well for an upside day, hence the downside bias. The markets didn’t disappoint as the Dow dropped 59 points and the other indices lost ground as well. Today we aren’t dealing with a correlated market however our bias is to the upside.
Could this change? Of Course. Remember anything can happen in a volatile market.
Commentary
Yesterday morning you could sense the negativity in the air as the futures were pointed downward and for good reason. The new British Prime Minister addressed the impending British exit (Brexit) from the EU in a speech yesterday morning. In essence she said that Britain still wanted to trade with the EU and buy their products and sell them British products but that Britain would no longer contribute any monies to the EU. It’s like saying I want a divorce but want to do so on friendly terms but don’t ask for money. Lots of luck with that. It appears as though the Trump Dump is in full swing as the concern is what will he do on Day One? Will he truly repeal Obamacare and if so what will replace it? He could surprise all of us and certainly has over the past year and a half but as we’ve stated previously he will have the most secretive administration that we’ll ever see and he’ll do so on the premise of “national security”…
Author

Nick Mastrandrea
Market Tea Leaves


