![]() Norm Winski
Norm Winski
Independent Analyst
SpeciaL feature - A lesson in market psychology
Friday, May 13, 2022 India bans wheat exports -
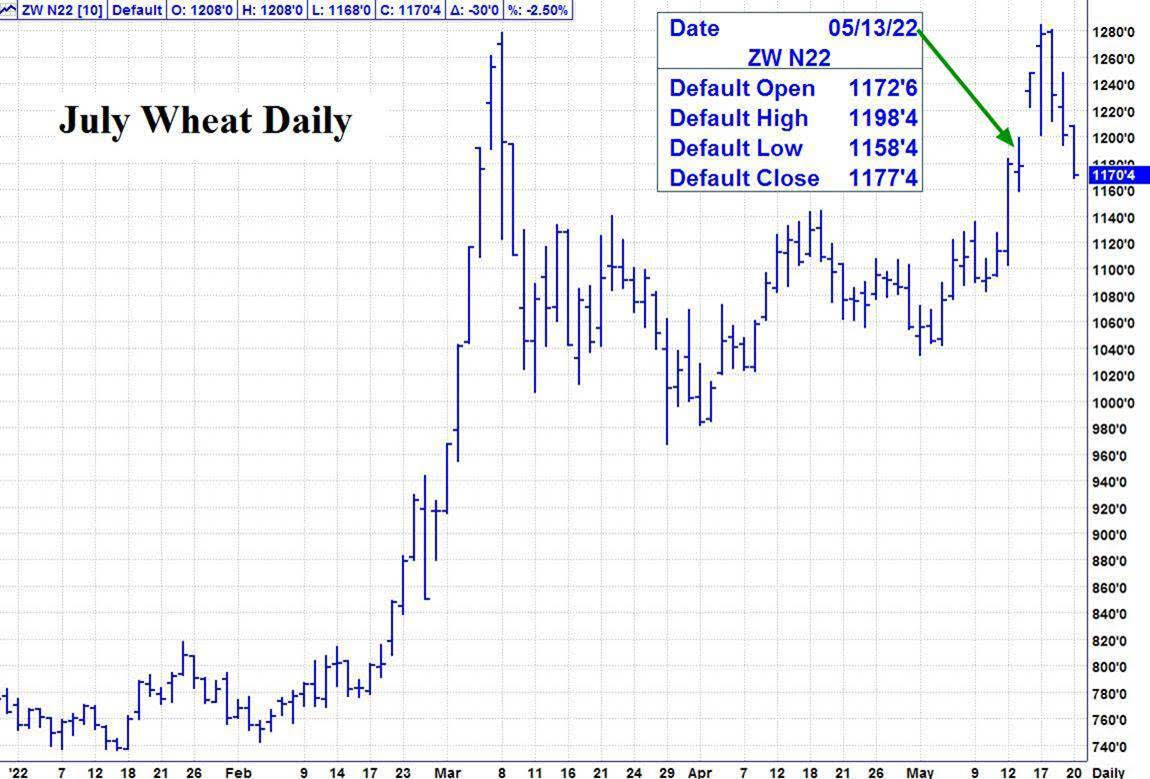
Please see the July Wheat Chart below.
As you can see, the market went higher for two more days,
making its peak on May 17, one day past the Lunar Eclipse. Please note that high is lower than the March peak.
Friday, May 20, the market closed below the price on May 13, at the time of the Indian Wheat export ban.
At the time of the Indian announcement, I said that could mark a major high in Wheat So far that is looking correct.
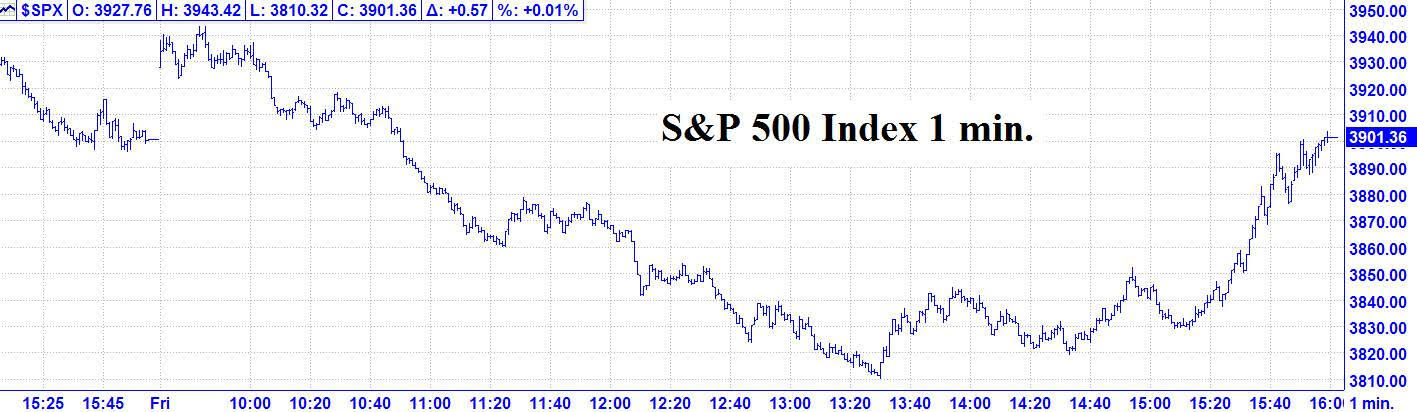
Recap 5/20 – Friday, the S&P gapped open up 27 handles and then rallied another 15 handles a 9:43 AM high of the day. From that high, the S&P declined 133 handles into a 1:30 PM low of the day and for a new 2022 low at 3810.32 . From that low, the S&P rallied 34 handles into a 1:57 PM high.
From that high, the S&P pulled back 24 handles into a 2:33 PM low. From that low, the S&P rallied 32 handles into a 2:54 PM high. From that high the S&P declined 23 handles into a 3:13 PM low. From that low, the S&P rallied 73 handles into the close.
5/20 – The major indices, had a strong open and then had a huge decline into an early afternoon low. The low achieved by the S&P 500, put that Index into bear market territory as Wall Street defines a Bear Market as a decline of 20% or more from a high. The 2022 high for the S&P 500 Index was
4818,62 on January 04, 2022. 20% from that high is 3854.90. From Friday’s low, the S&P and the other indices had a huge recovery rally to close almost unchanged for the day per the following closes: DJIA + 8.77; S&P 500 + 0.57; and the Nasdaq Composite - 33.88.
Looking ahead – Our next change in trend point is 5/23 AM. A strong up open, carrying over from Friday’s strong close, could set up a short term high in the first few hours. Please see details below.
The Now Index is in the BUY ALERT ZONE. This is a cautionary signal that there is a moderate imbalance of too many shorts.
This is not an outright buy signal.
Coming events
(Stocks potentially respond to all events).
- A. 5/23 AM – Jupiter 90 US Venus. Major change in trend US Stocks, T-Bonds, US Dollar.
- 5/24 AC – Geo Mars enters Aries. Important change in trend Corn, Gold, OJ, Silver, Sugar, Wheat.
- 5/27 AC – Mercury Aphelion. Major change in trend Corn, Oats, Soybeans, Wheat.
- 5/27 AC – Jupiter 45 US Moon. Moderate change in trend US Stocks, T-Bonds, US Dollar.
- 5/27 AC – Jupiter Parallel Latitude Neptune. Major change in trend Commodity Index, Oats, Oil.
- 5/27 AC– Helio Saturn Contra-Parallel Uranus. Major change in trend Cattle, Coffee, Copper, Cotton.
- 5/27 AC – New Moon in Gemini. Major change in trend Financials, Grains, Precious Metals
Stock market key dates
5/28 (Sat.) = 8,100 (90^2) days > 3/24/2000 MAJOR TOP.
Fibonacci – 5/28.
Astro – 5/23, *5/27*.
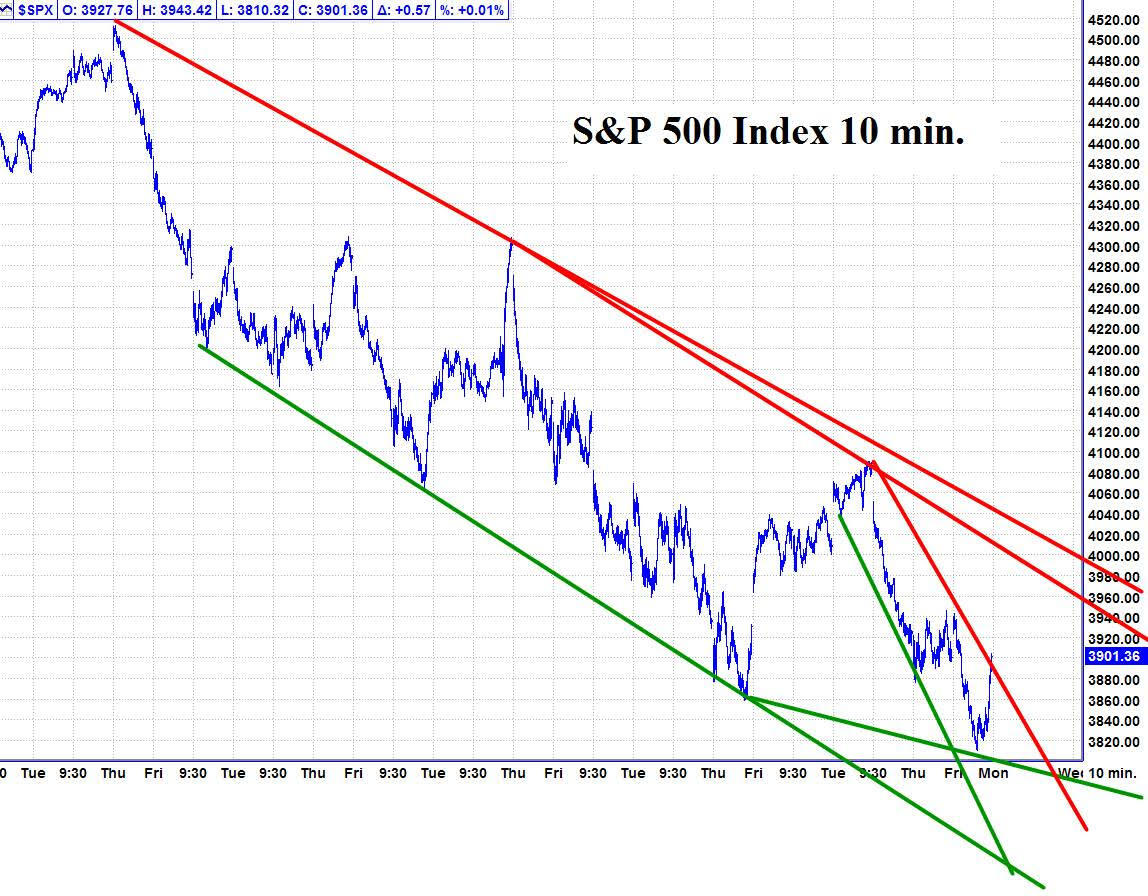
Please see below the S&P 500 10 minute chart.
Support - 3810, 3790 Resistance – 3980.
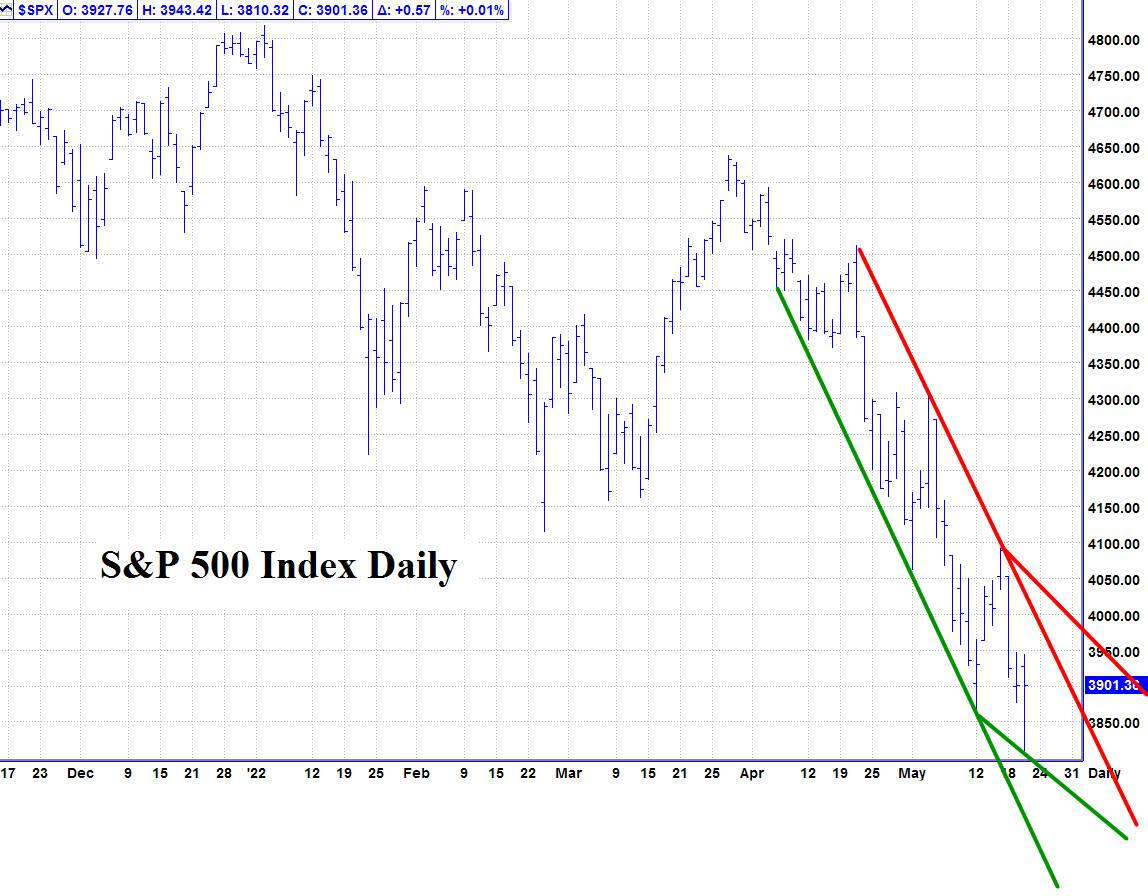
Please see below the S&P 500 Daily chart.
Support - 3810, 3790 Resistance – 3980.
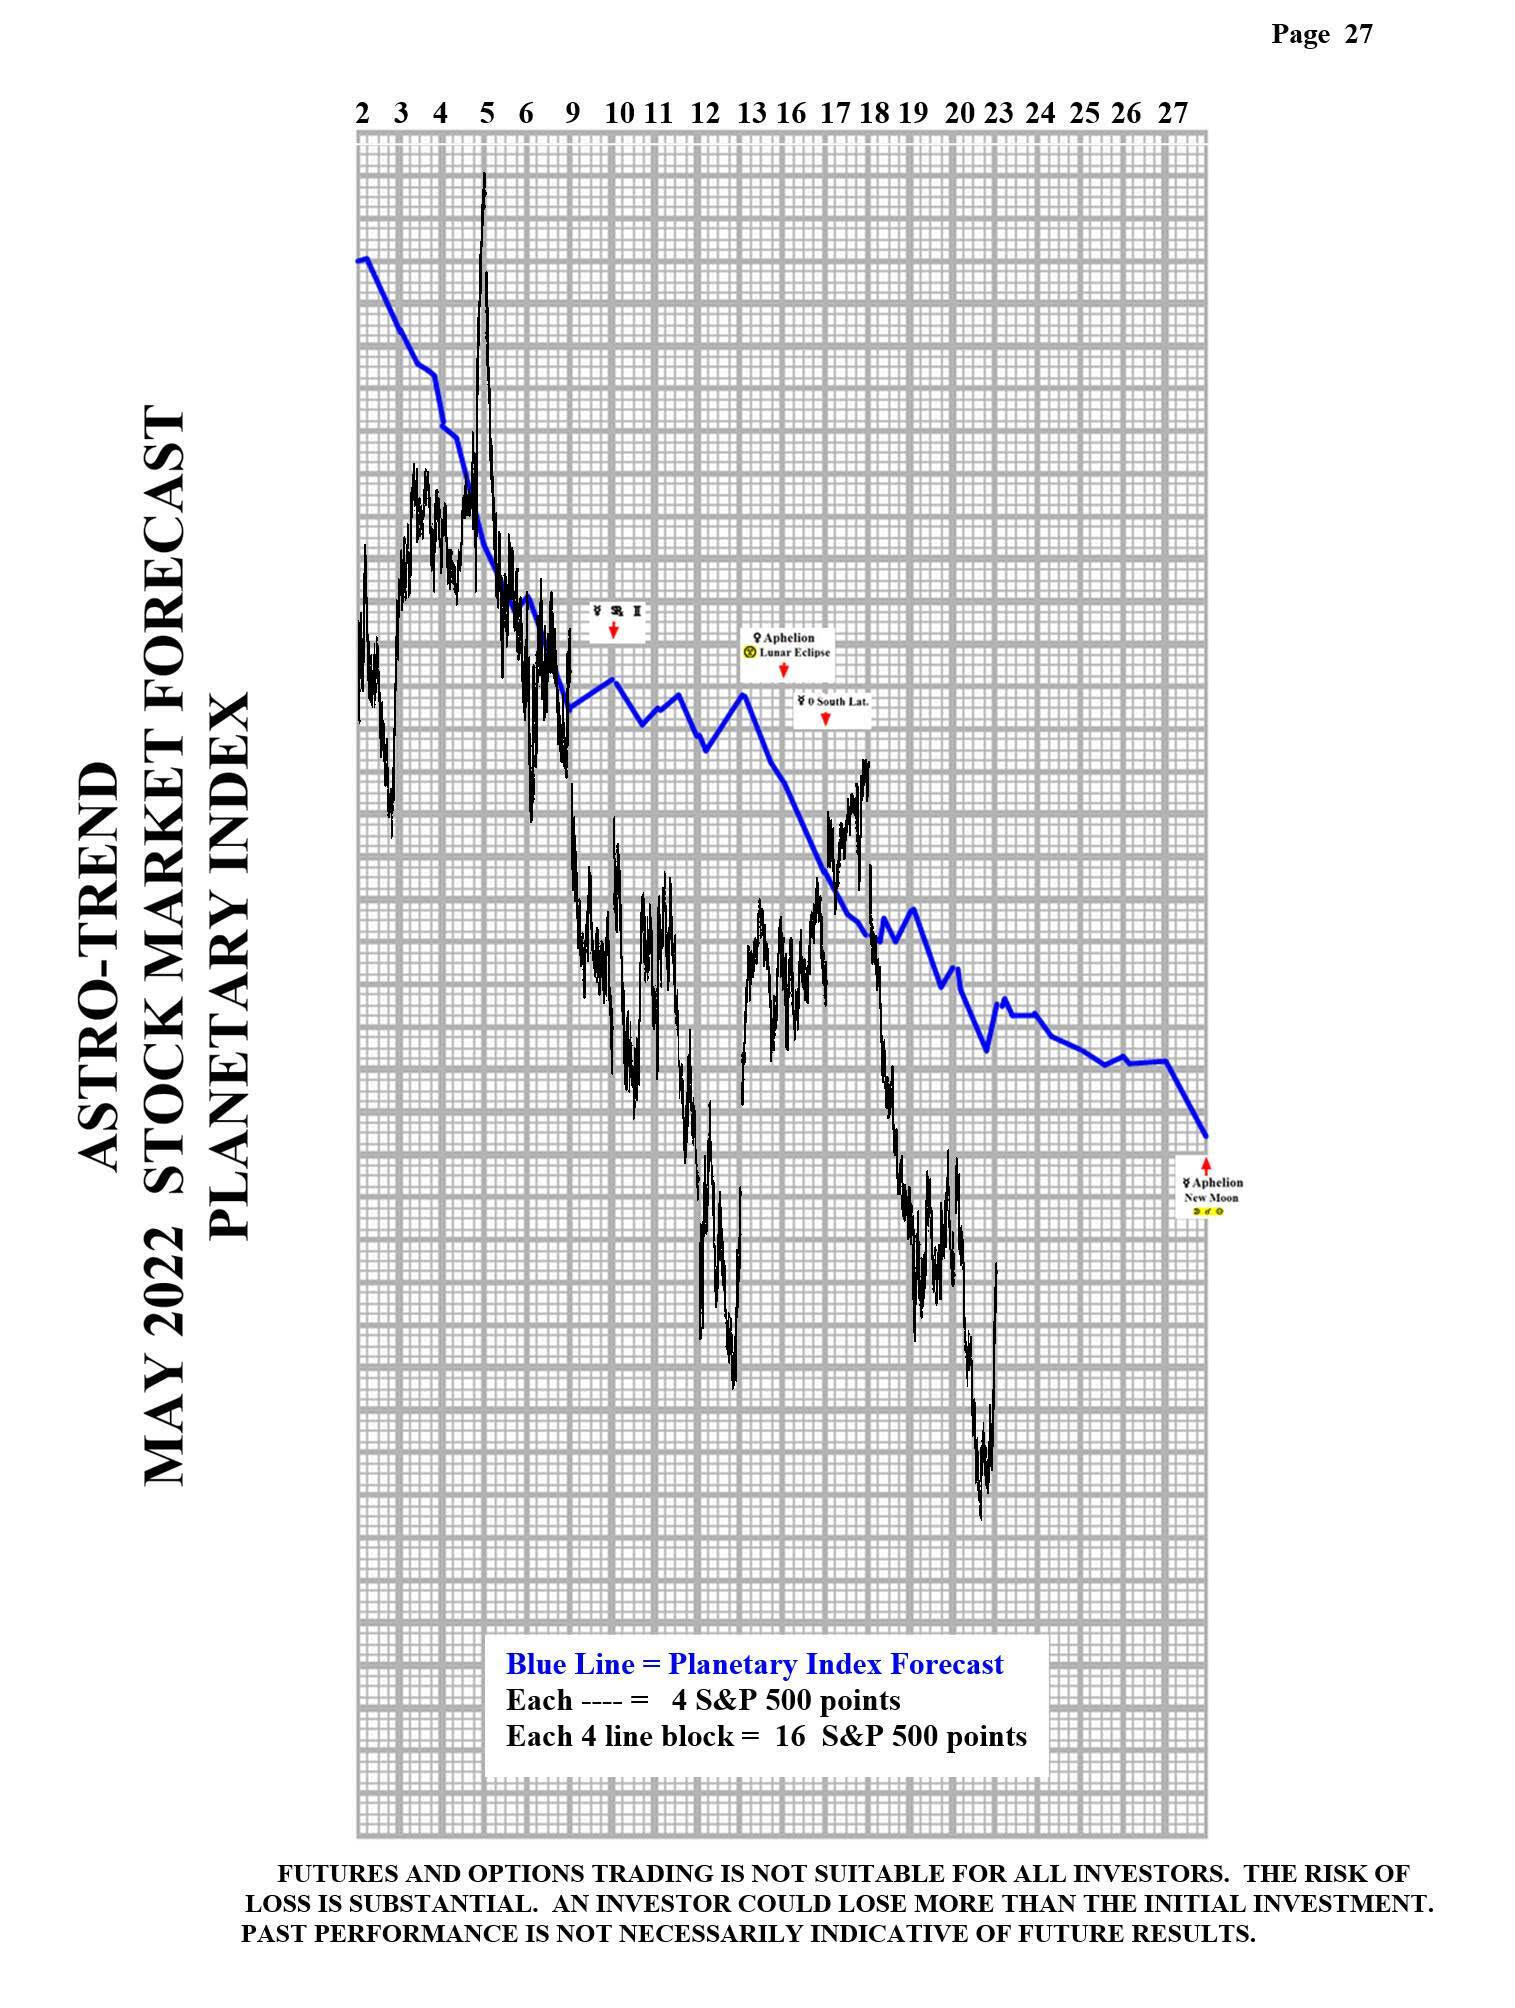
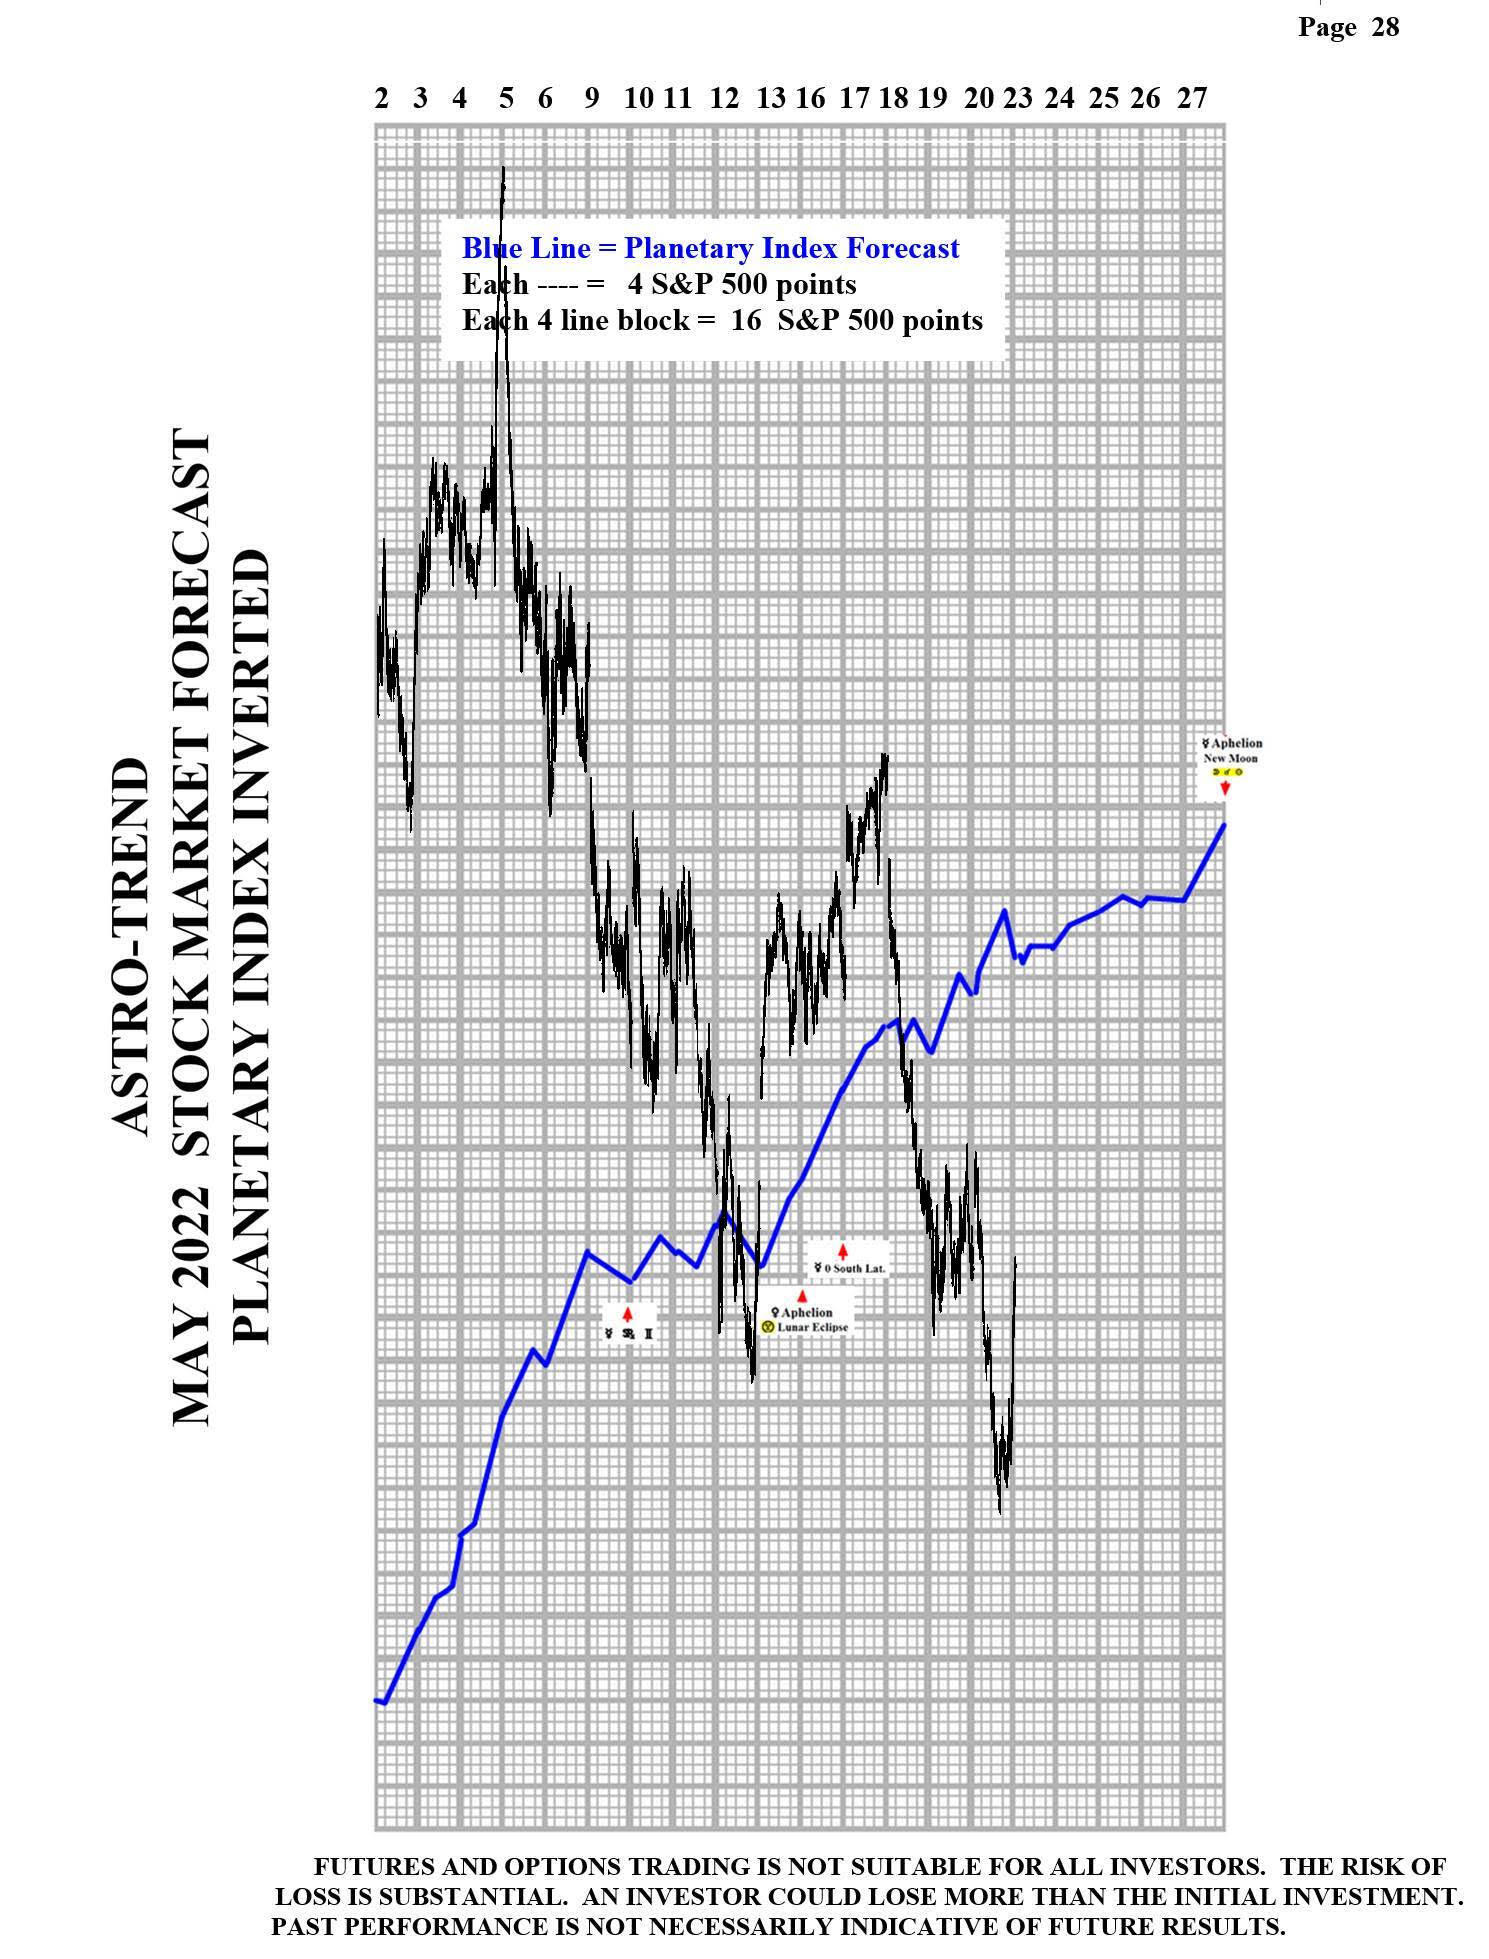
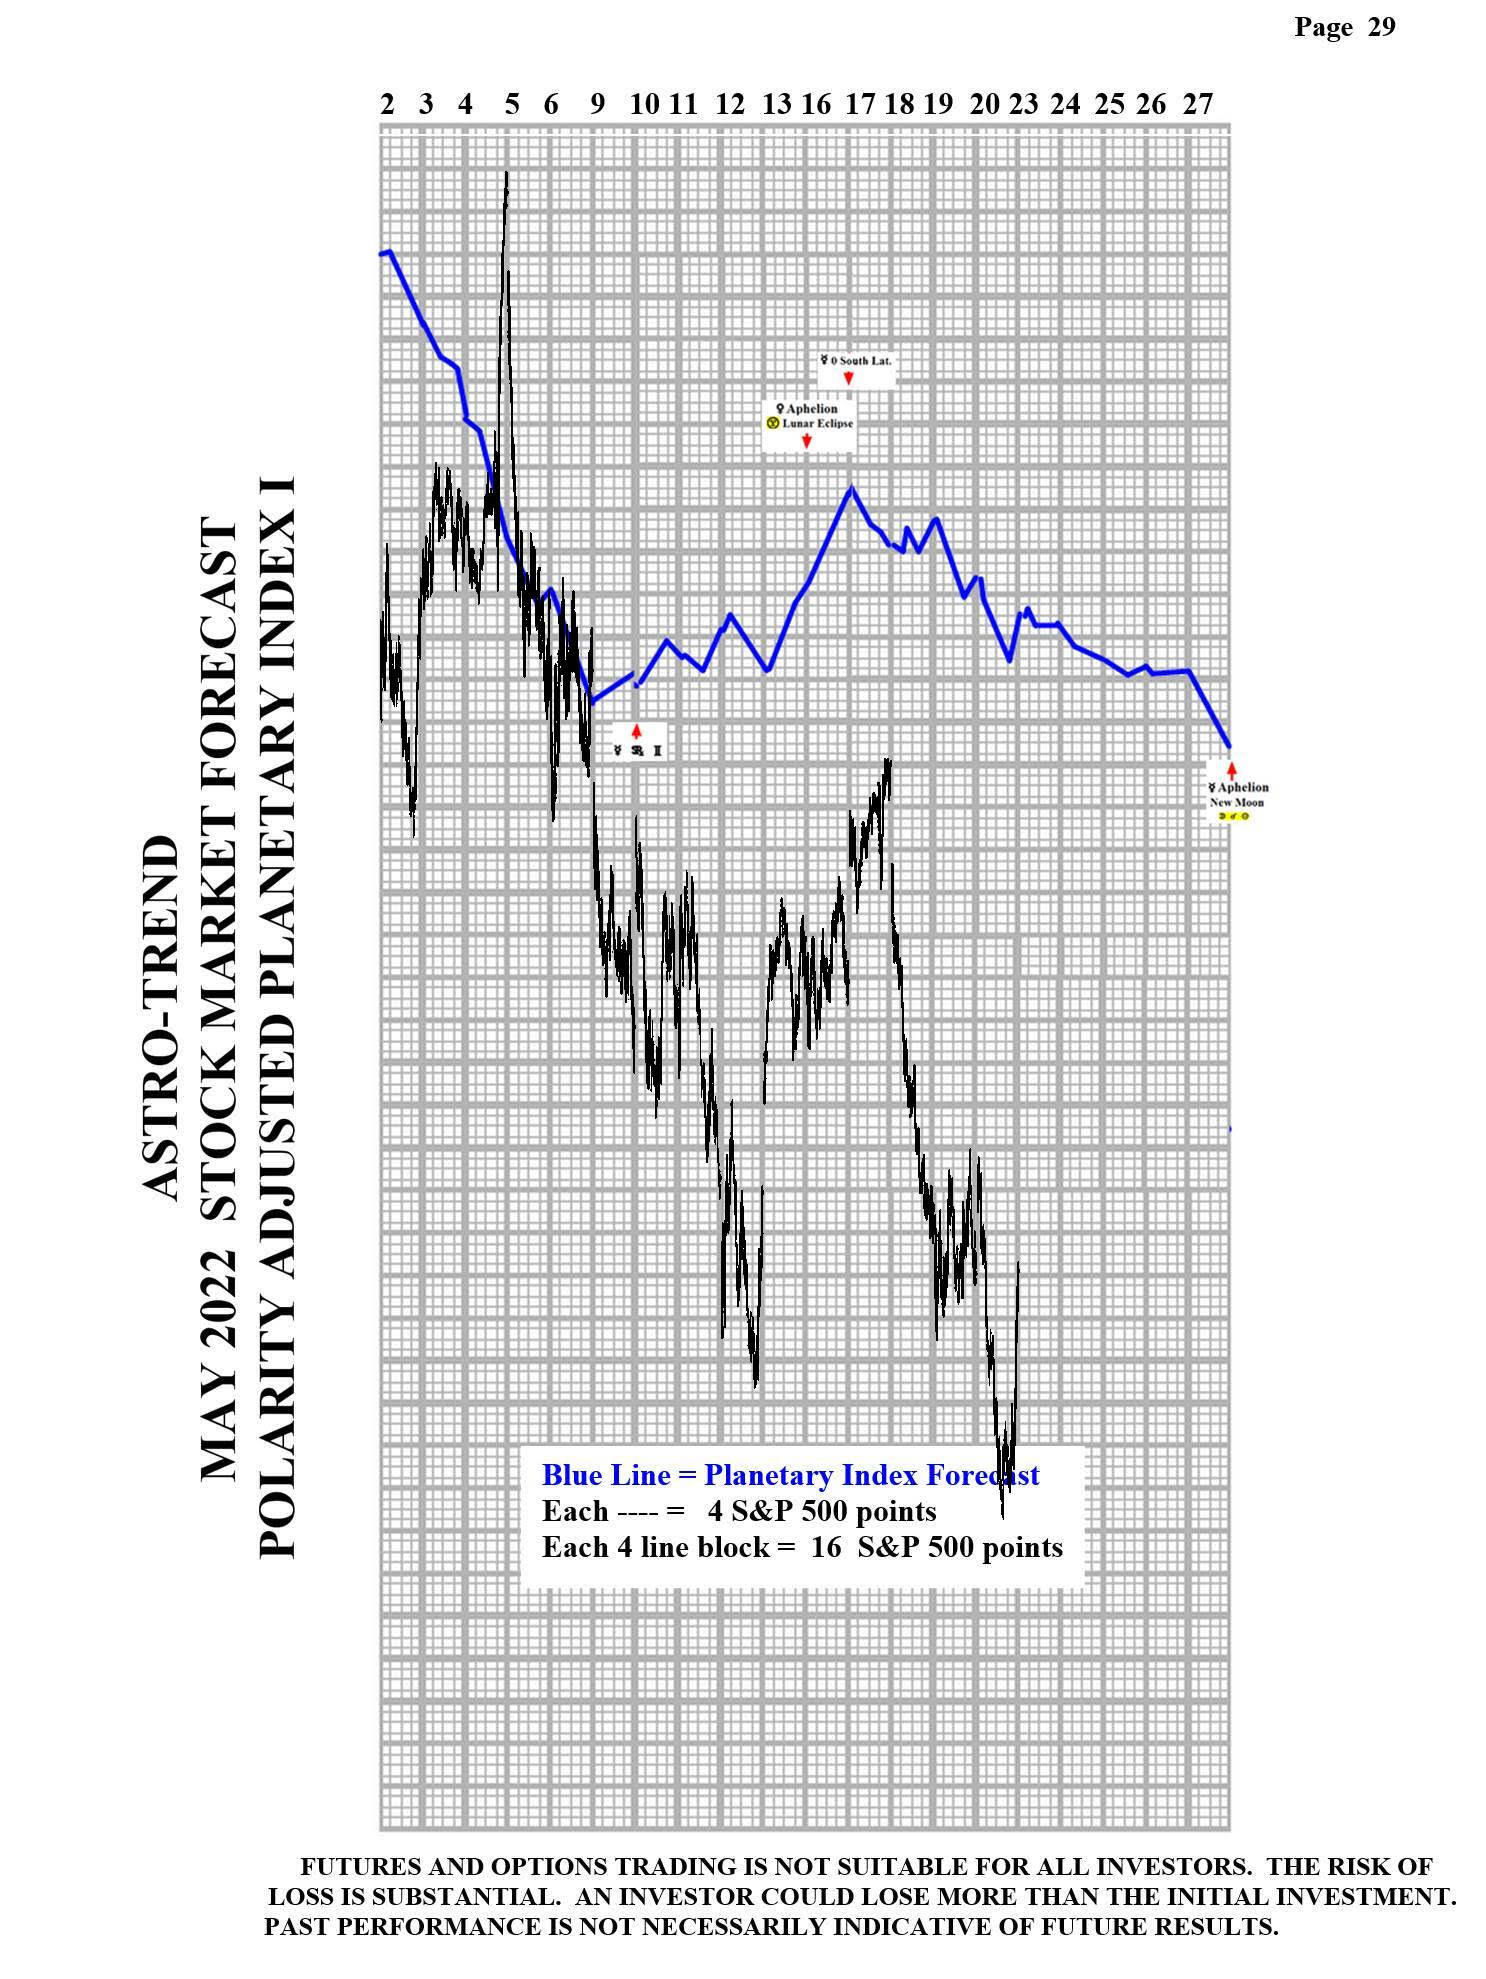
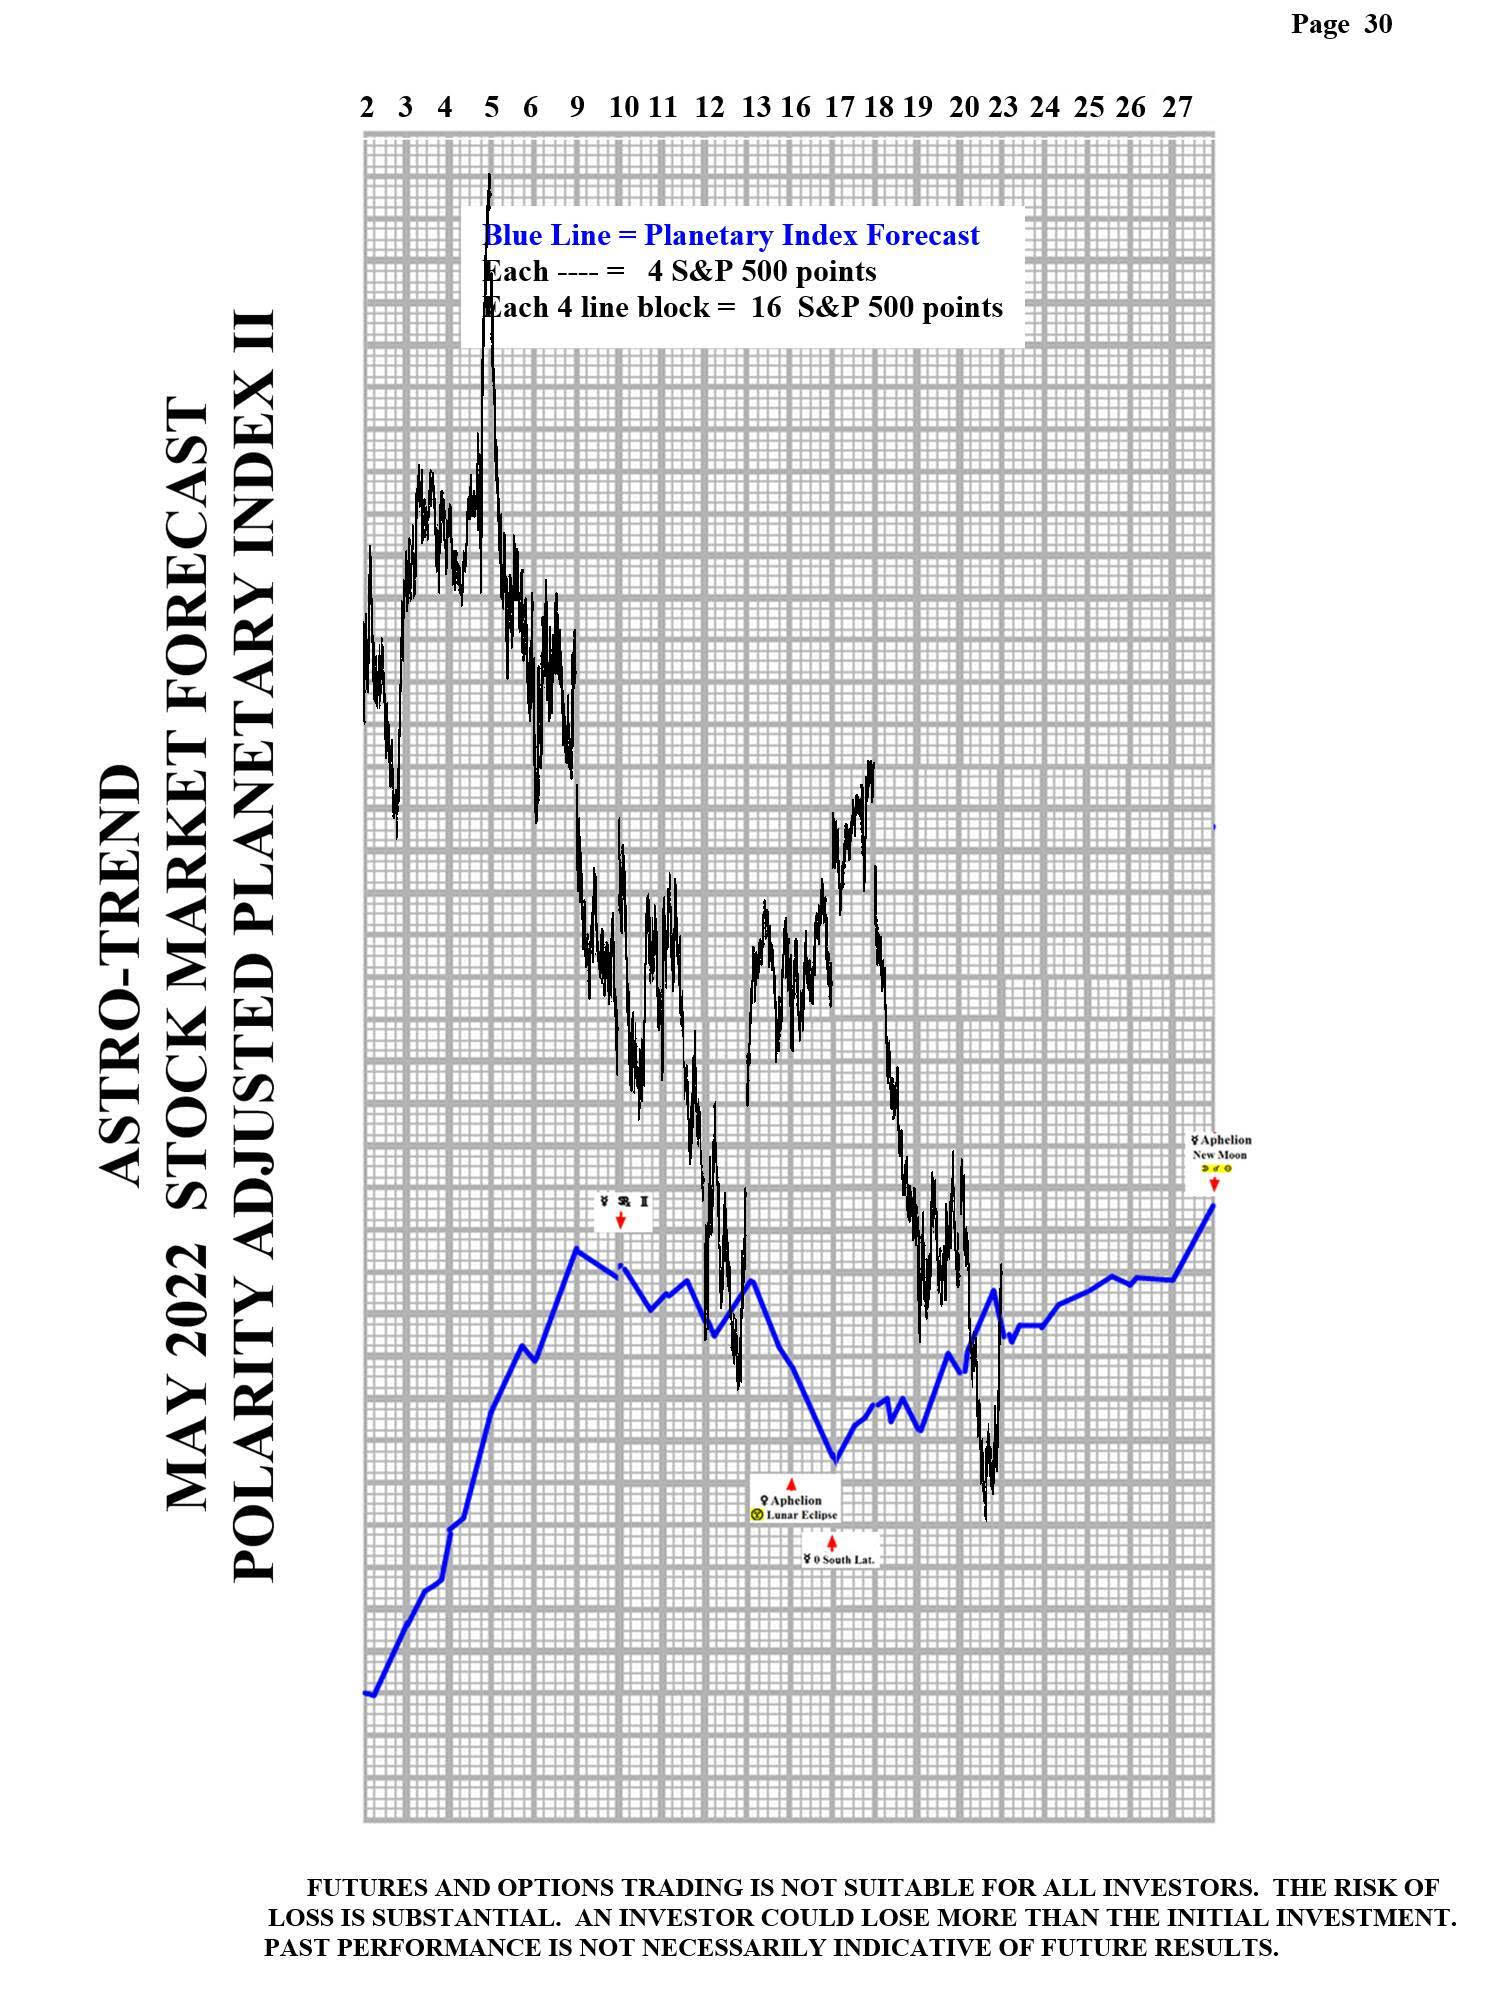
Please see below the April Planetary Index chart with S&P 500 10 minute bars for results.
Note: All information on this page is subject to change. The use of this website constitutes acceptance of our user agreement. Please read our privacy policy and legal disclaimer. Opinions expressed at FXstreet.com are those of the individual authors and do not necessarily represent the opinion of FXstreet.com or its management. Risk Disclosure: Trading foreign exchange on margin carries a high level of risk, and may not be suitable for all investors. The high degree of leverage can work against you as well as for you. Before deciding to invest in foreign exchange you should carefully consider your investment objectives, level of experience, and risk appetite. The possibility exists that you could sustain a loss of some or all of your initial investment and therefore you should not invest money that you cannot afford to lose. You should be aware of all the risks associated with foreign exchange trading, and seek advice from an independent financial advisor if you have any doubts.
Recommended Content
Editors’ Picks
USD/JPY jumps above 156.00 on BoJ's steady policy

USD/JPY has come under intense buying pressure, surging past 156.00 after the Bank of Japan kept the key rate unchanged but tweaked its policy statement. The BoJ maintained its fiscal year 2024 and 2025 inflation forecast, disappointing the Japanese Yen buyers.
AUD/USD consolidates gains above 0.6500 after Australian PPI data

AUD/USD is consolidating gains above 0.6500 in Asian trading on Friday. The pair capitalizes on an annual increase in Australian PPI data. Meanwhile, a softer US Dollar and improving market mood also underpin the Aussie ahead of the US PCE inflation data.
Gold price keeps its range around $2,330, awaits US PCE data

Gold price is consolidating Thursday's rebound early Friday. Gold price jumped after US GDP figures for the first quarter of 2024 missed estimates, increasing speculation that the Fed could lower borrowing costs. Focus shifts to US PCE inflation on Friday.
Stripe looks to bring back crypto payments as stablecoin market cap hits all-time high

Stripe announced on Thursday that it would add support for USDC stablecoin, as the stablecoin market exploded in March, according to reports by Cryptocompare.
US economy: Slower growth with stronger inflation

The US Dollar strengthened, and stocks fell after statistical data from the US. The focus was on the preliminary estimate of GDP for the first quarter. Annualised quarterly growth came in at just 1.6%, down from the 2.5% and 3.4% previously forecast.