Treasury capitulation is a necessary evil

Market capitulations aren’t pretty to look at and are even more ugly for those caught in the crosshairs. The dictionary definition of capitulation is “the action of surrendering or ceasing to resist an opponent or demand.” When markets capitulate, surrendering is synonymous with selling, and the opponent is either oneself or their capital limitations. In other words, assets are generally liquidated out of need rather than desire during market capitulations.
We suspect those who are selling Treasury futures at these levels are doing so because they must do so to meet margin calls, lessen their emotional duress, out of fear of being a bag holder, or are succumbing to a FOMO (Fear of Missing Out) mentality (missing out on profits in short Treasury positions and ETFs). Otherwise, it is difficult to justify the act of selling, not buying, low-risk securities yielding 4% to 5% when historical returns for risk assets aren’t much higher (particularly after paying management and portfolio fees). In any case, emotional trading at the end of a cycle is standard, and unfortunately, it is often necessary for the next price regime to occur.
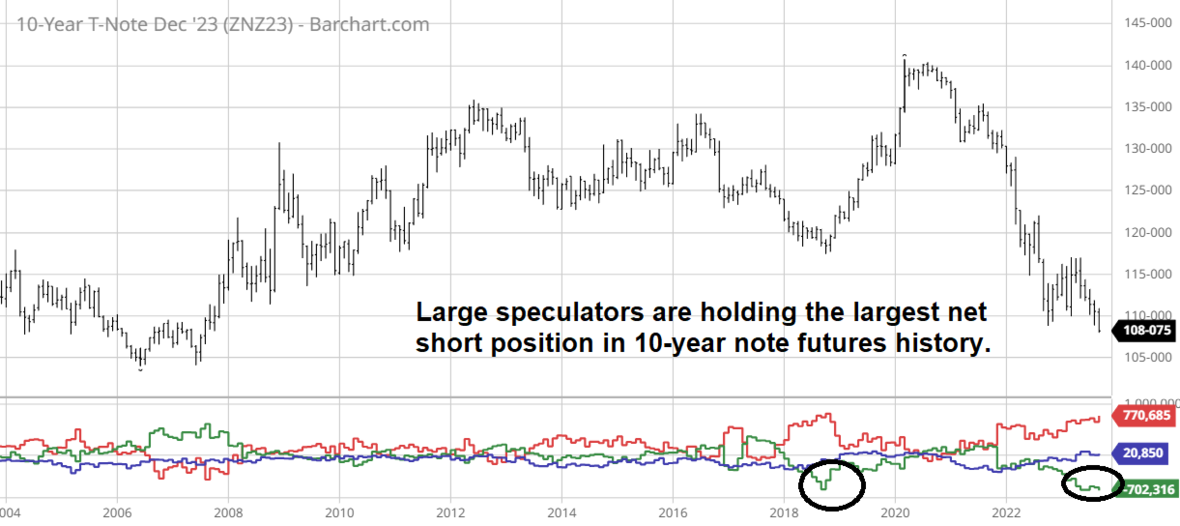
According to the Commitments of Traders (COT) Report, large speculators (those with prominent position sizes and deep pockets and are considered to be the “smart money”) are holding the largest net short position in the history of 10-year note futures. Other analysts have pointed out that many of the open short futures contracts displayed on the COT Report are hedges against cash market positions and, therefore, “this time is different.” Yet, the same was said of the recent record net short holding in E-mini S&P 500 futures, resulting in an unexpectedly large 2023 equity rally as the overcrowded trade was unwound. Maybe this time is different, but we doubt it. The odds favor an eventual unwind of the overly bearish 10-year note trade; the massive amount of short covering could easily push yields back into the 2% handle (yes. I said it).
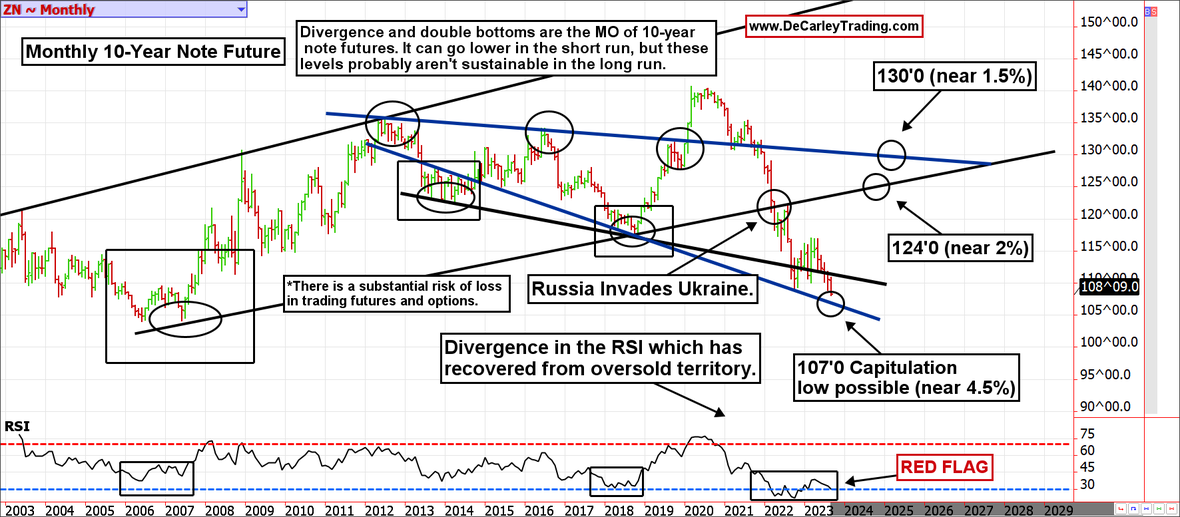
We would have preferred not to see full-blown capitulation in Treasuries, but it isn’t unexpected and doesn’t change the bigger picture. A monthly chart of the 10-year note future suggests prices could see 107’0 (slightly lower than the recent low) and a yield of just over 4.5%, but the chart calls for a dramatic reversal from such levels. A significant trendline comes in at 107’0, but more interestingly, the RSI (Relative Strength Index) is oversold but shows an unusual divergence from the underlying price. This means as the futures market is making new lows, the RSI is making higher lows. While it might take time for this to matter, it almost always does (eventually).
Market correlations are running unusually hot, often a sign of market dysfunction. It also suggests that if Treasuries turn the corner in the coming days, as the charts depict, we will also see a dollar and stocks reversal. That said, the stock market would likely be the last to turn the corner.
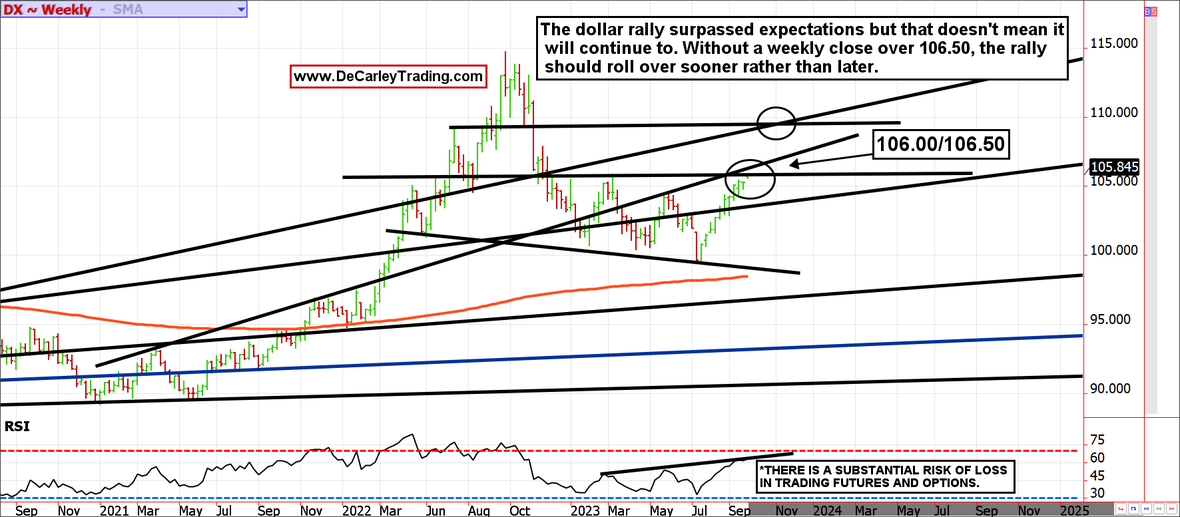
The US dollar rally has surpassed our original expectations. We had been looking for 104.00 to be where the buying dries out, but we are now looking at resistance at 106.00 and 106.50. Despite the market coloring outside the lines, we continue to believe the dollar rally is corrective rather than a resurgence of a bull market. However, if we are wrong and the dollar manages a weekly close over 106.50, the next stopping point would be closer to 110.00. That would be a worst-case scenario for stocks, bonds, and most commodities.
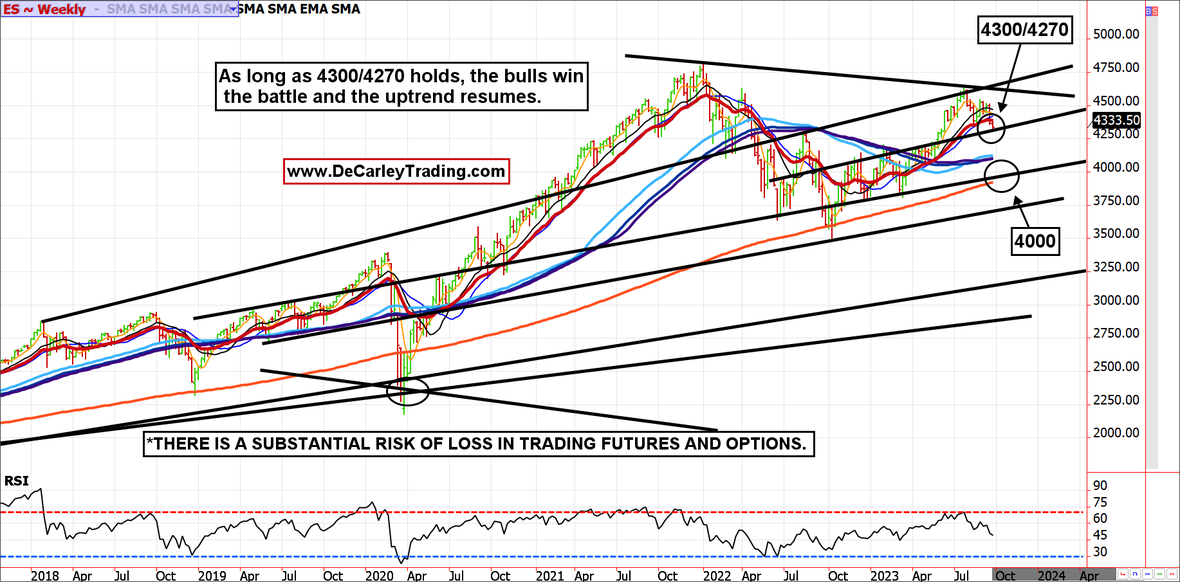
Equity indices are technically in a bull market. Since bottoming last year, the S&P 500 has consistently made higher highs and higher lows. With help from interest rates and currencies, as we anticipate, this should continue. We see significant support near 4300 and again near 4270; these levels represent a retest of the summer breakout and should hold in a bullish environment.
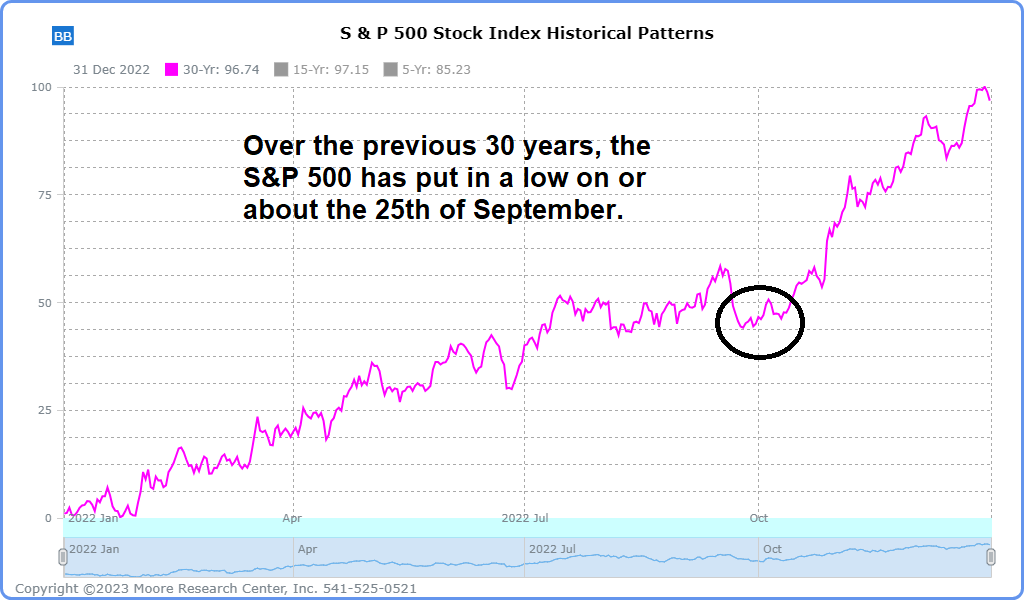
Further, seasonality often improves from here; according to our friends at MRCI (Moor Research Center, Inc.), buying the December NASDAQ 100 E-mini future on September 25th and holding through late October has been a winner roughly 80% of the time over 15 years. Similarly, the S&P 500 futures have historically found a low on, or about, September 25th before the typical year-end rally. This is particularly true in pre-election years.
The equity market feels dicey, but it always does during a correction. The daily RSI reading has reached 30.00, and the Williams %R, a quicker-paced oscillator, is trolling zero; these are both pointing toward an oversold market due for a bounce. Further, the 200-day moving average near 4300 should offer significant support.
Although the weekly chart isn’t as stretched as the daily chart, we can see that the trendline that previously acted as resistance before the summer breakout is now supportive. Coincidently, that line falls near the 200-day moving average (4300/4270). If we are wrong about the 4270ish area holding, the next support level is all the way down at 4000!
Over the last thirty trading days, the 10-year note future and the S&P 500 have moderately settled in the same direction over 70% of the time. Further, both of these assets have closed in the opposite direction of the US dollar index futures contract over 70% of the time. It is clear that interest rates are driving the ship, but that ship could be on the cusp of taking a major turn. If so, we can expect trend changes in other assets such as stocks, currencies, and most commodities. If you are waiting for a place to get bullish gold, look for a potential turn between $1900 and $1870 in the coming week or so. Further, a reversal in rates and currencies would be the boost oil needs to reach our $100 target!
Author

Carley Garner
DeCarley Trading
Carley Garner is an experienced commodity broker with DeCarley Trading, a division of Zaner, in Las Vegas, Nevada. She is also the author of multiple books including, “Higher Probability Commodity Trading” and “A Trader's First Book on Commodities”.














