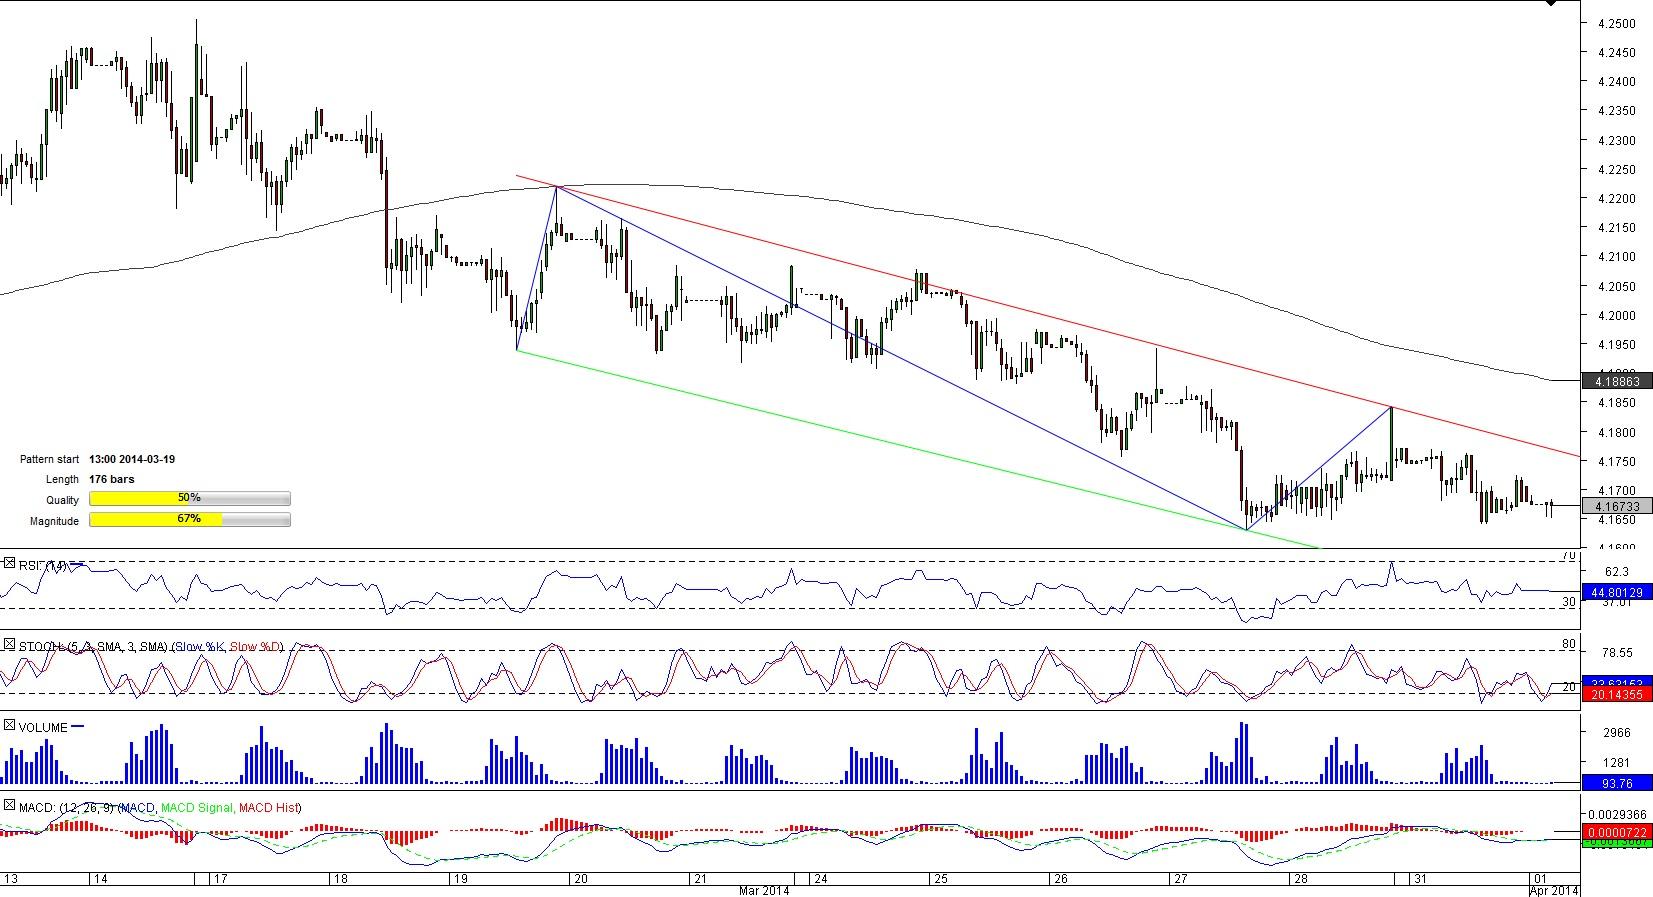
EUR/PLN 1H Chart: Channel Down
Comment: Since mid-March, the Euro has been losing ground against most of its counterparts and the Polish Zloty was not an exception. After EUR/PLN touched a six-week high of 4.2506 on March 13, the pair started a retreat that eventually led to a formation of the channel down pattern.
At the moment, the pair is trading slightly below its 50-hour SMA meandering at 4.1711 and may try to penetrate this formidable resistance in the hours to come given bullishness on the market. According to the SWFX data, over 62% of market participants bet on appreciation of the currency couple.
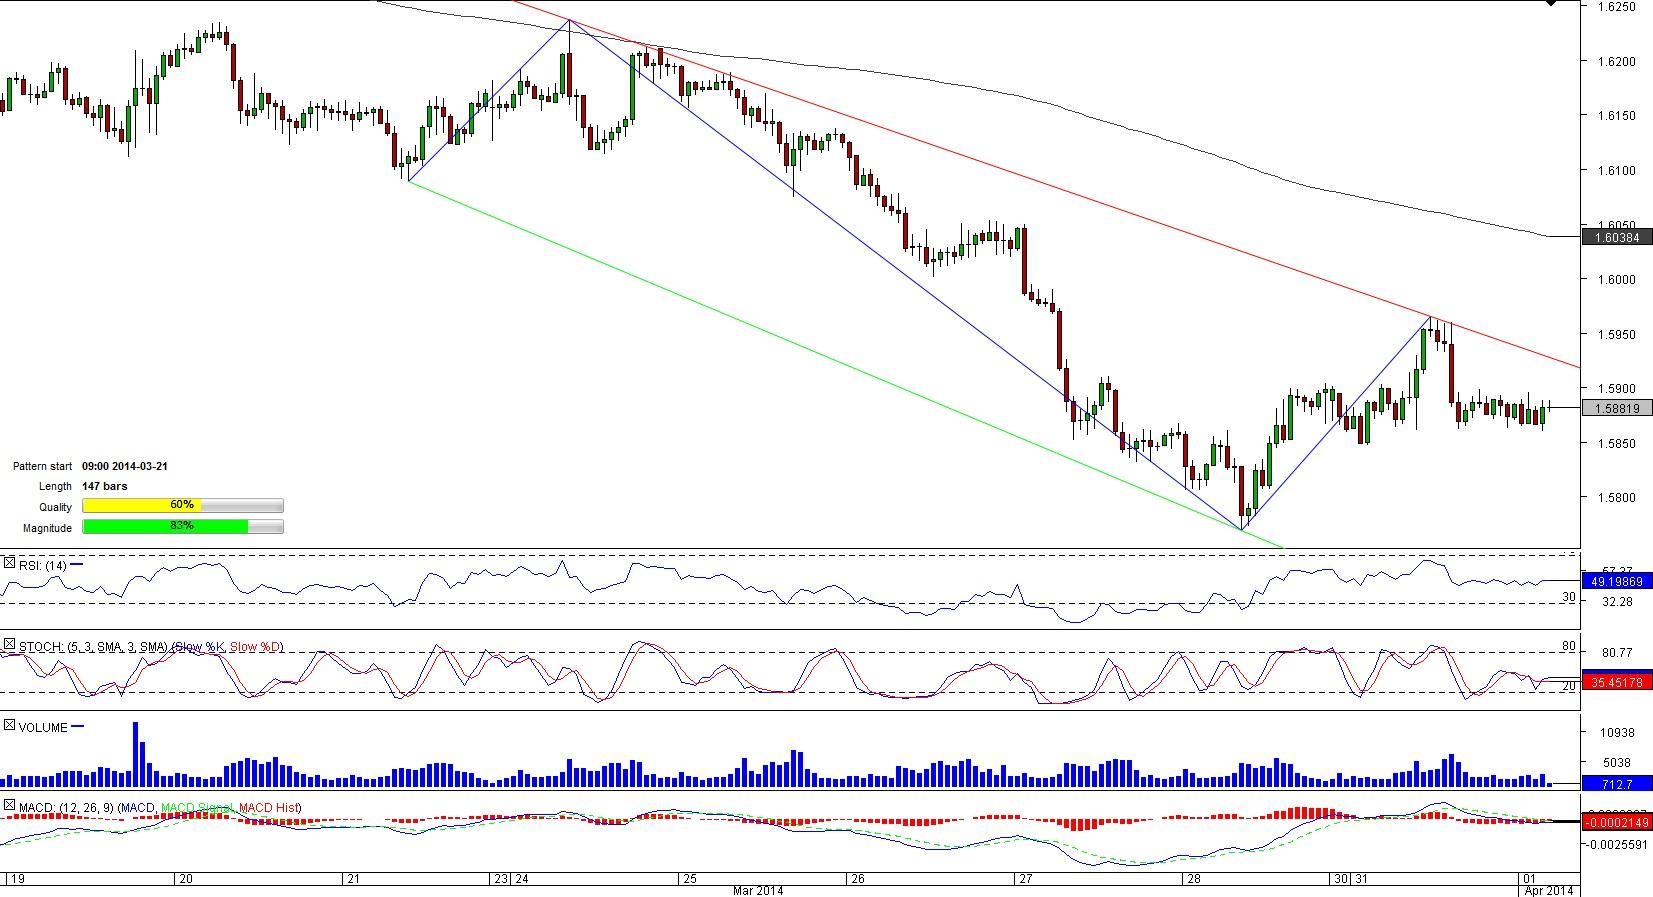
EUR/NZD 1H Chart: Channel Down
Comment: The direction of another Euro cross, EUR/NZD, also demonstrates the single currency’s weakness. After the commencement of the bearish correction on March 12, the pair started to shape a downward-sloping tunnel, which sent it to a one-year low of 1.5772 hit in the last trading sessions of March. The beginning of April brought some relief, with the Euro paring loses against its overseas peer by bouncing off the recent low and breaking through the short-term SMA at 1.5876, above which EUR/NZD is sitting now. However, the pair may continue the downswing as more than 62% of all orders are placed to sell the currency pair, according to the SWFX data.
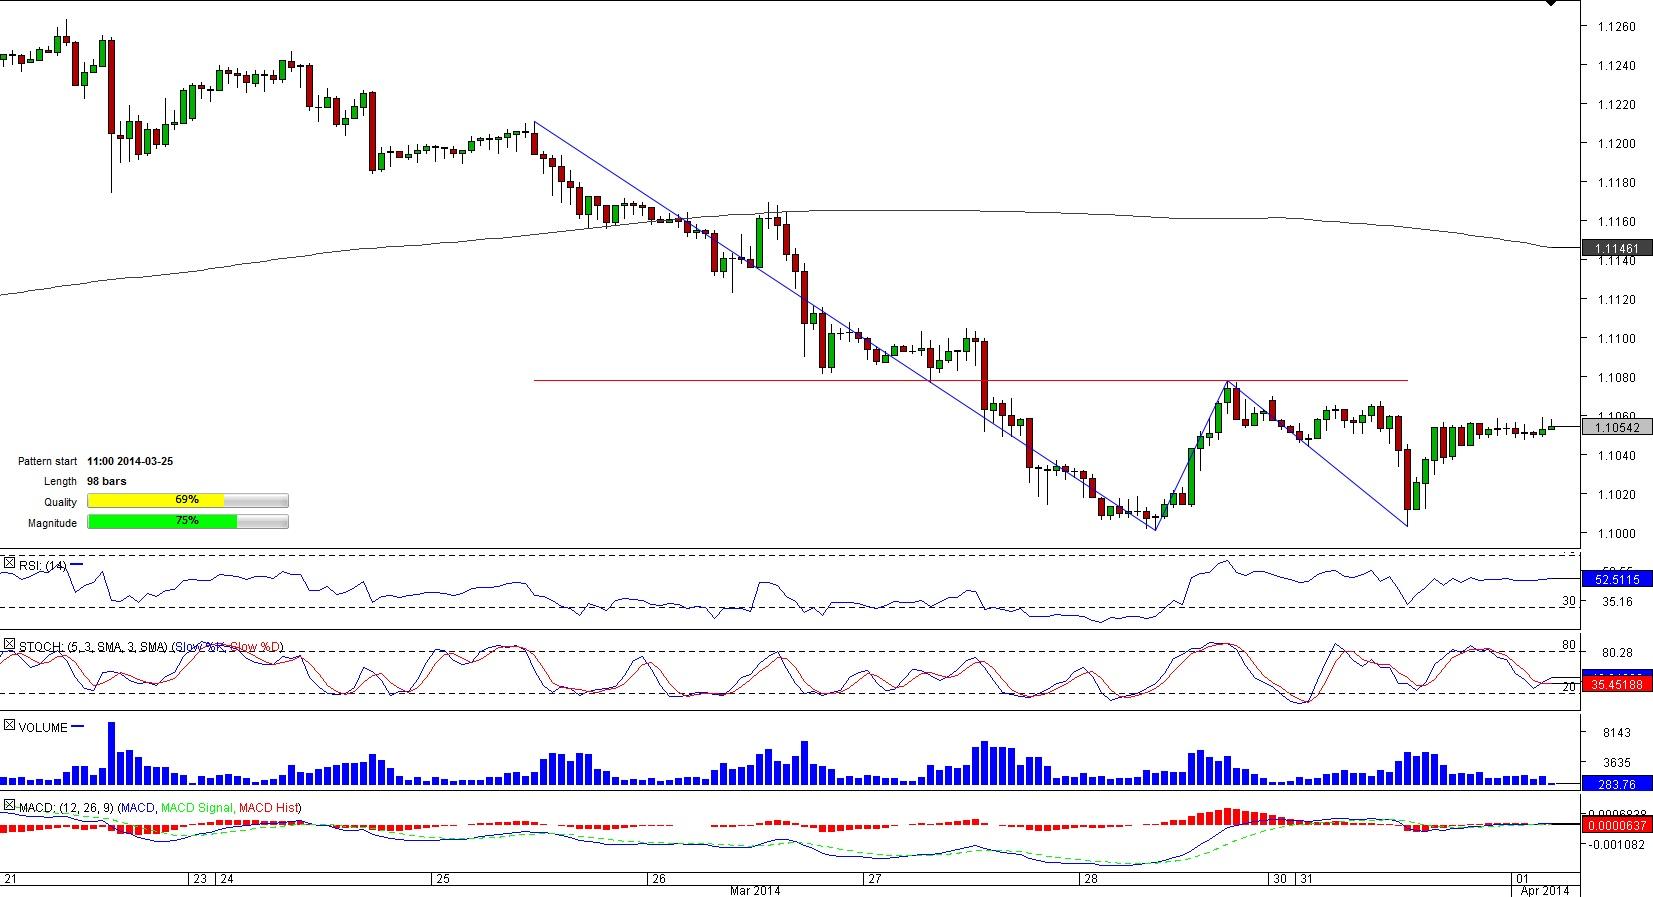
USD/CAD 1H Chart: Double Bottom
Comment: A stab to a five-year high of 1.1279 provoked a decline of the U.S. Dollar against the neighbouring country’s currency. The drop was halted only at a three-week low of 1.1002, the lowest mark of the 98-bar long double bottom pattern.
Now the pair is gradually nearing the neck-line at 1.1078 and may reach it before long given absence of any significant hurdles for the rise. To climb to the neck-line, above which USD/CAD may enjoy a sharp rally, the pair has to meet resistance only at 1.1058/69 (four-hour R1, R2, R3) and considering bullishness on the market-circa 65% of positions are long, the advance is not likely to be discouraged by this hindrance.
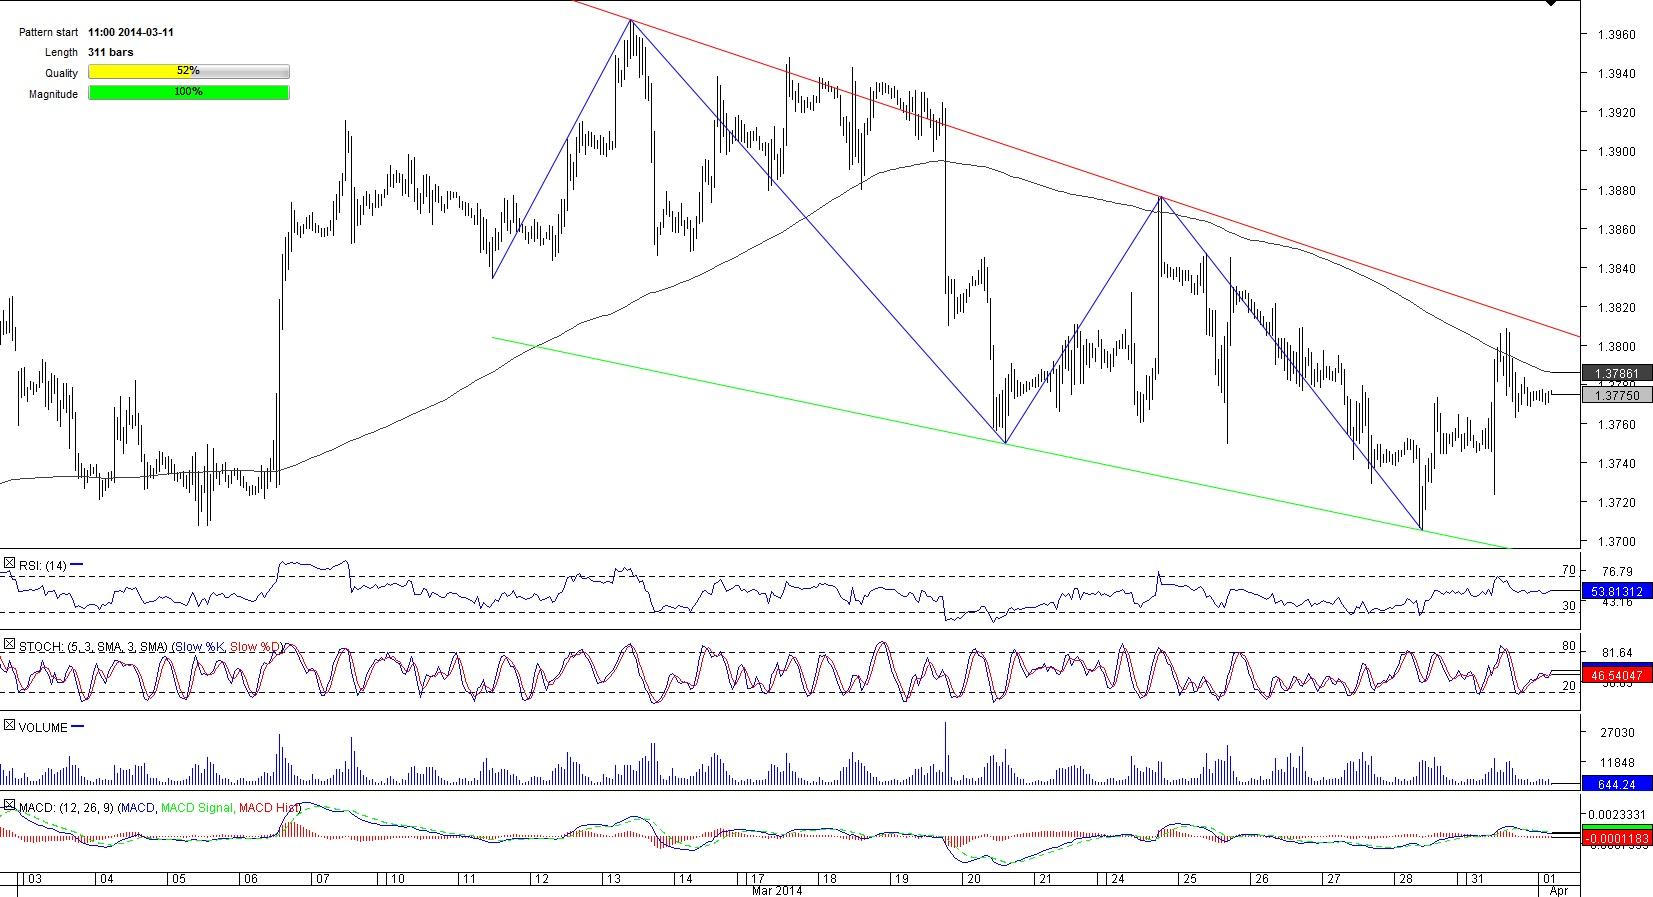
EUR/USD 1H Chart: Falling Wedge
Comment: A jump to a two-year high of 1.3966 seems to have exhausted the potential of the most traded currency pair. After a rise to this high, EUR/USD entered a bearish formation, falling wedge, that despite having average quality has high magnitude and is over 300-bar long.
Currently, the pair is locked between 50-and 200-hour SMAs, with the 200-hour SMA at 1.3785 restricting the up-trend and the 50-hour SMA at 1.3760 acting as a strong support zone. In the hours to come, the pair is likely to move closer to the long-term SMA as almost two thirds of market players at the SWFX are bullish on the pair.
This overview can be used only for informational purposes. Dukascopy SA is not responsible for any losses arising from any investment based on any recommendation, forecast or other information herein contained.
Recommended Content
Editors’ Picks
EUR/USD declines below 1.0700 as USD recovery continues

EUR/USD lost its traction and declined below 1.0700 after spending the first half of the day in a tight channel. The US Dollar extends its recovery following the strong Unit Labor Costs data and weighs on the pair ahead of Friday's jobs report.
GBP/USD struggles to hold above 1.2500

GBP/USD turned south and dropped below 1.2500 in the American session on Thursday. The US Dollar continues to push higher following the Fed-inspired decline on Wednesday and doesn't allow the pair to regain its traction.
Gold stuck around $2,300 as market players lack directional conviction

Gold extended its daily slide and dropped below $2,290 in the second half of the day on Thursday. The benchmark 10-year US Treasury bond yield erased its daily losses after US data, causing XAU/USD to stretch lower ahead of Friday's US jobs data.
Top 3 Price Prediction BTC, ETH, XRP: Altcoins to pump once BTC bottoms out, slow grind up for now

Bitcoin reclaiming above $59,200 would hint that BTC has already bottomed out, setting the tone for a run north. Ethereum holding above $2,900 keeps a bullish reversal pattern viable despite falling momentum. Ripple coils up for a move north as XRP bulls defend $0.5000.
Happy Apple day

Apple is due to report Q1 results today after the bell. Expectations are soft given that Apple’s Chinese business got a major hit in Q1 as competitors increased their market share against the giant Apple.


