Top Trade Setups in Forex – Risk-off Sentiment In Play

The commodity-linked currencies were broadly lower against the greenback. AUD/USD and NZD/USD lost 0.4% to 0.6873 and 0.6637, respectively, while USD/CAD gained 0.2% to 1.3063. Government data showed that China's GDP grew 6.0% in the year as expected in the fourth quarter.
The U.S. government bond prices declined further after the Treasury Department announced plans to sell 20-year government bonds later this year. The benchmark U.S. 10-year Treasury yield advanced to 1.834% from 1.809% Thursday. Today, the U.S. session may drive thin volatility in the wake of King Martin Luther's day holiday.
USD/JPY - Sideways Pattern Unchanged
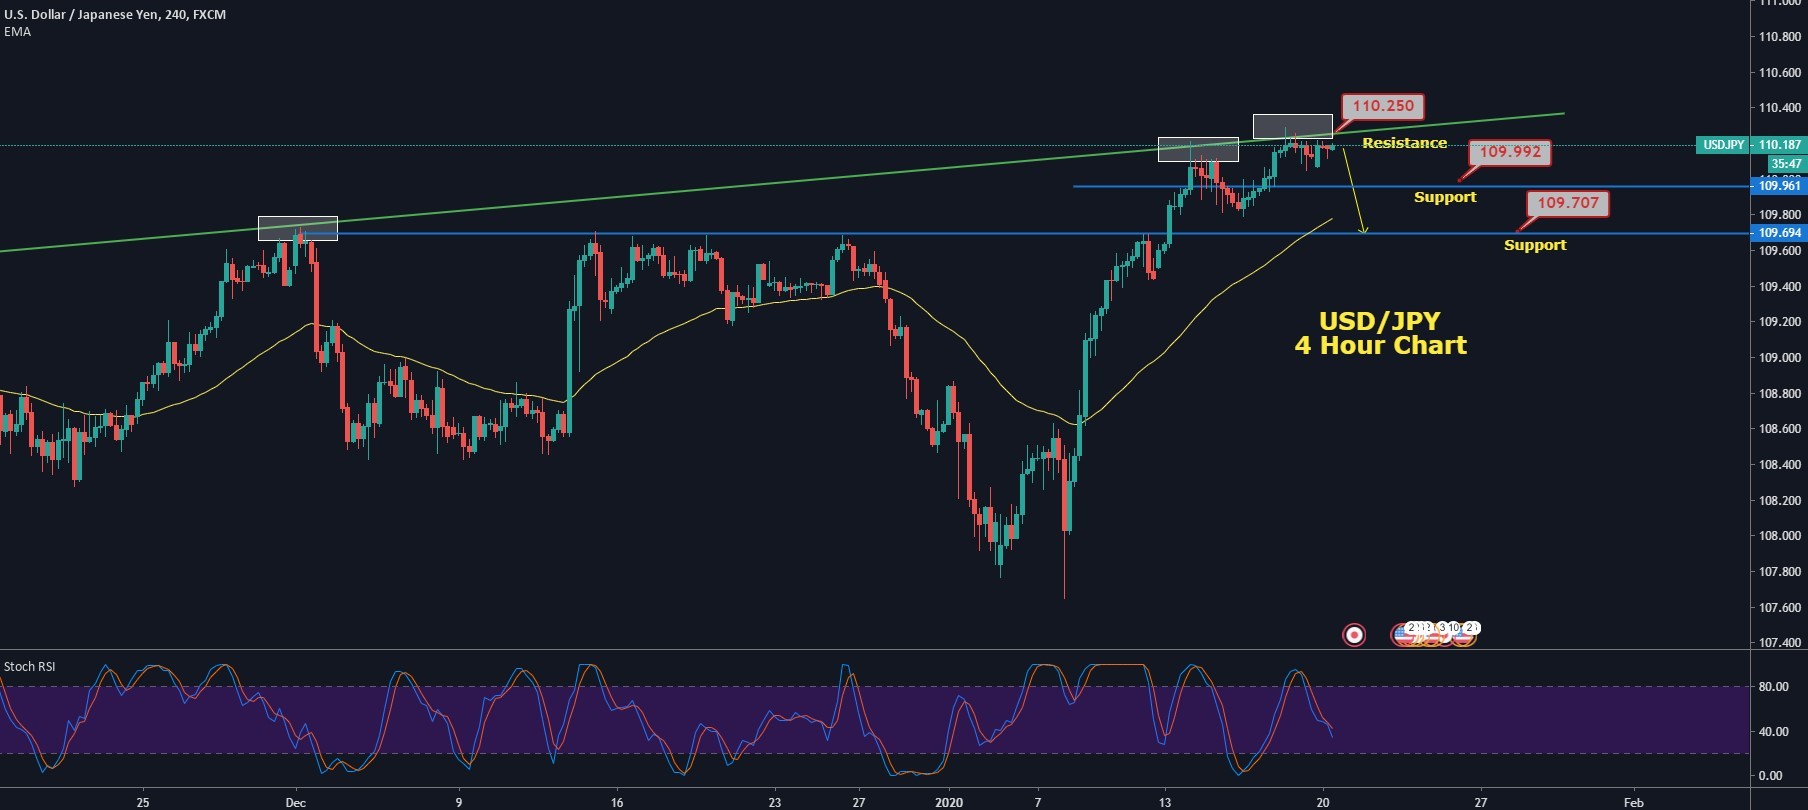
The USD/JPY currency pair was moving sideways and struggled near the 110.00 as traders stuck between the on-going Libyan crisis and broad-based USD strength. As the pair initially responded to the risk-off market sentiment, which came due to bad news from Libya. As a result, the pair dropped to 110.05 from the Friday close range near the 110.15. As of writing, the USD/JPY currency pair is currently trading at 110.14 and is consolidating in the interval between the 110.08 - 110.22.
At the main news front, there was no lack of power show in the Middle East, and this time it's Libya that took trader's minds back to 2011. The oil-rich nation was experiencing a power play where one of the top leaders, KhalifaHaftar, recently blocked the country's exports by 800,000 barrels per day.
Moreover, the news came recently that Libya left Iran behind in intensifying the geopolitical risk to the global economy. However, Tripoli seems weak by the power in comparison to Iran.
However, despite this, the significant risk still surrounding crude oil prices after the forces loyal to KhalifaHaftar breached the ceasefire in Tripoli again and opened gun firing on Khallatat frontline.
On the other hand, the beginning of U.S. President Donald Trump's impeachment trial from Tuesday will also remain under the trader's eyes.
At the BOJ front, the Bank of Japan's 2-day meeting regarding monetary policy, which is scheduled to start today, the market is not expecting any surprises from the BOJ because nothing major has come after the last meeting in December.
While soft inflation will keep BOJ to continue its easy-money policies forward, the tone of the central bankers will be the key to observe in the minutes' statement. Moreover, Japan's November month Industrial Production, expected to remain stable at -8.1% and will be the key in the time of the U.S. markets' holiday. Whereas, the headlines related to Sino-US and Libya will be the key to watch.
USDJPY - Daily Technical Levels
|
Support |
Pivot Point |
Resistance |
|
110.11 |
110.15
|
110.24 |
|
110.01 |
110.29 | |
|
109.97 |
110.38 |
USD/JPY - Daily Trade Sentiment
The USD/JPY continues to consolidate at the top around 110.250, which is resistance to the USD/JPY near 110.250. On the downside, the USD/JPY pair is expected to gain support around 109.850. Violation of this support can drive more sales until 109.650.
The Stochastic is enduring below 50, which is implying bearish bias. Let's watch for bearish positions below 110.15 today to target 109.850 and 109.650.
USD/CAD - Sideways Trading Continues
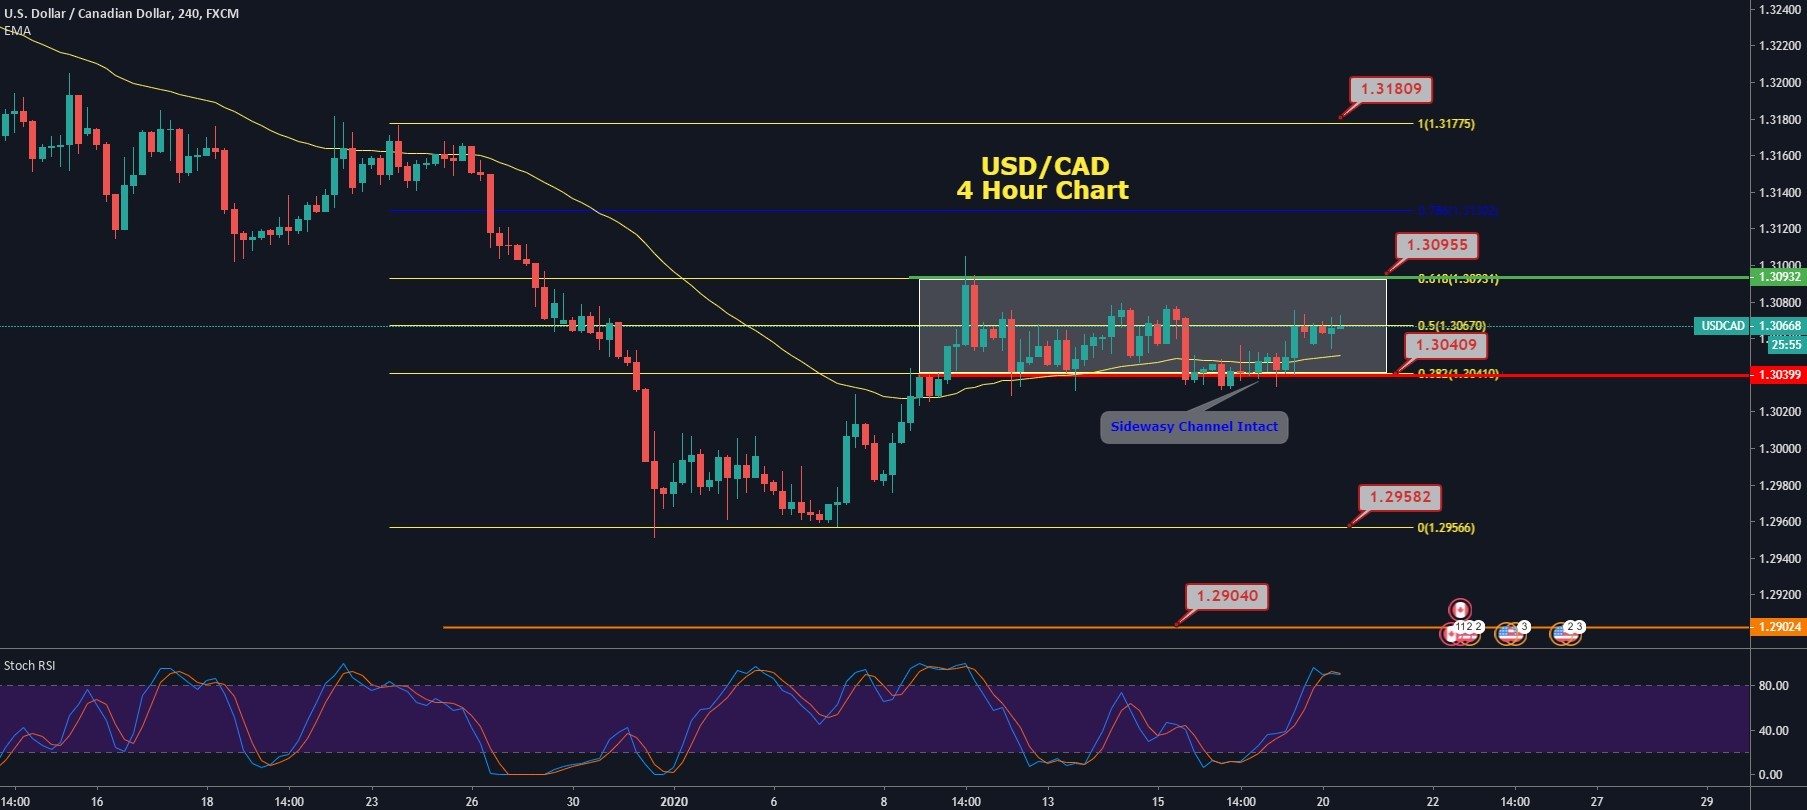
The USD/CAD pair was closed at 1.30696 after placing a high of 1.30748 and a low of 1.30335. Overall the movement of USD/CAD remained bullish throughout the day.
The pair USD/CAD moved sideways during the early trading session on Friday but gained traction in late sessions and touched a high of 1.3075 level. It was all because of broad-based U.S. dollar strength and weak crude oil performance.
The U.S. Dollar Index, which gauges the value of the U.S. dollar against the basket of six currencies, posted highs on Friday. It rose to its highest since December 26 on Friday to 97.66 on the back of rising U.S. Treasury yields and robust macroeconomic data.
The U.S. Census Bureau announced on Friday that Housing Starts in December increased to 1.61M from the expected 1.38M and supported the U.S. dollar. The inflation expectations also rose to 2.5% despite the contraction in Industrial Production by 0.3%.
The strong U.S. dollar across the board pushed USD/CAD prices on Friday near the 1.3075 level. The weakness of Crude oil prices also supported it.
The barrel of West Texas Intermediate (WTI) Crude Oil failed to increase on Friday on the back of weekly data published by Baker Hughes. According to data, the number of active oil rigs in the United States increased to 673 from 699, and this weighed on crude oil prices, which in turn made it difficult for commodity-linked currency- Loonie to gain traction in the market.
The weak Canadian Dollar, due to decreased prices of crude oil, added in the upward movement of USD/CAD pair on Friday. On the other hand, the Foreign Securities Purchases for November showed a massive decline to -1.75B against the expectations of 12.32B and weighed heavily on Canadian Dollar. The weaker than expected macroeconomic data from Canada further supported the bullish trend of the USD/CAD pair.
USD/CAD- Daily Technical Levels
|
Support |
Pivot Point |
Resistance |
|
1.3060 |
1.3064
|
1.3069 |
|
1.3055 |
1.3073 | |
|
1.3051 |
1.3079 |
USD/CAD- Daily Trade Sentiment
The USD/CAD is consolidating in a narrow trading range of 1.3095 - 1.3040. Traders seem to look for a solid reason to determine the bullish or bearish trend in the USD/CAD.
The formation of candles beneath 1.3040 can lead USD/CAD towards 1.3000 and 1.2950, while bullish breakout of 1.3095 can drive buying until 1.3150. Let's do choppy trading until breakout occurs.
AUD/USD – Bullish Channel Breakout
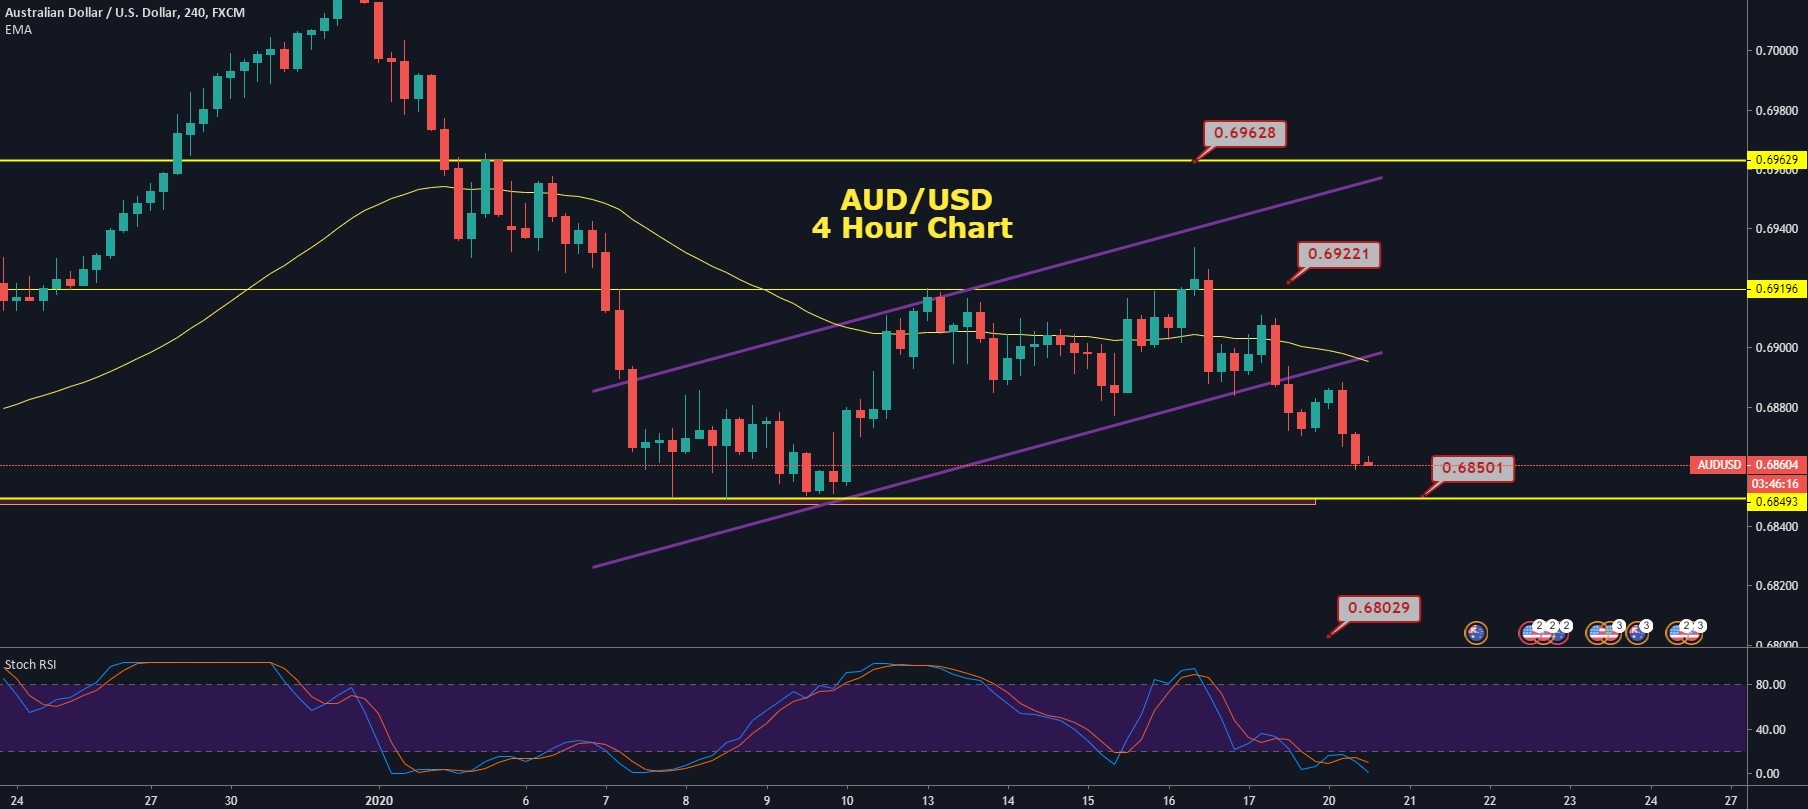
The pair AUD/USD was closed at 0.68710 after placing a high of 0.69108 and a low of 0.68704. Overall the pair AUD/USD moved in a bearish trend that day.
The pair AUD/USD dropped to its five days lowest point near 0.68700 level on the back of rising U.S. dollar demand in the market. The pair finished its week almost where it was started because of the absence of any dominant trend this week. The prices seesawed between gains and losses throughout the week due to U.S. dollar weakness in the early days of the week.
Aussie is affected by the Chinese data, and on Friday, the upbeat data from China also failed to move the AUD/USD pair in a bullish trend. At 7:00 GMT, the Chinese quarterly Gross Domestic Product (GDP) was released, which came in line with the expectations of 6.0%. It was one of the reports which were under the focus of the attention of traders on Friday.
However, despite no change in GDP, the Industrial Production in China for 2019 showed an increase of 6.9%, which was expected to be 5.9% and supported the Australian Dollar.
An increase in industrial production was a good sign for Australian Dollar, but it failed to post gains for AUD/USD pair on Friday as the U.S. dollar was active in the market.
The U.S. dollar on the back of upbeat economic data remained strong throughout the market in the last two days of the week. The strong Retail Sales on Thursday and the influential Housing figures and Inflation Expectations from the United States rose U.S. dollar Index. The U.S. Dollar Index rose to its highest since26 December to 97.66 level on Friday and dragged the AUD/USD prices.
The AUD/USD pair prices also suffered because, despite the signing of a phase-one trade deal between China & the U.S., the uncertainty persisted in the market related to global growth. The growth of the World's economy was related to the tariffs imposed by both U.S. & China on each other products.
But when the details of the phase-one trade deal revealed that tariffs were not rolled back and they were still unchanged, the market's expectations for global growth fell and weighed on Australian Dollar. The less demand for Aussie also caused the bearish trend for AUD/USD pair on Friday.
However, on the positive note, U.S. President Donald Trump announced that in Phase-two of a trade deal between the U.S. & China, the rolling back of tariffs would be discussed, and the negotiations for that will be started soon.
AUD/USD - Technical Levels
|
Support |
Pivot Point |
Resistance |
|
0.6875 |
0.6879
|
0.6886 |
|
0.6867 |
0.6891 | |
|
0.6863 |
0.6898 |
AUD/USD - Daily Trade Sentiment
The AUD/USD has violated the bullish channel, which was supporting the AUD/USD around 0.6885. Recently, the AUD/USD pair has closed strong bearish candles on the 4-hour chart, which are suggesting odds of selling trend in the Aussie. On the lower side, the pair can exhibit selling until 0.6840, while the closing of candles above this level can help us capture a buy position. Consider taking sell trades below 0.6879 today.
Author

EagleFX Team
EagleFX
EagleFX Team is an international group of market analysts with skills in fundamental and technical analysis, applying several methods to assess the state and likelihood of price movements on Forex, Commodities, Indices, Metals and


