|

US CPI set to move Gold and Silver markets

The US CPI print on Wednesday at 13:30 UK time sits in a light calendar week for US data. The CPI print is likely to draw significant attention tomorrow to see how the US is doing in its fight against inflation.

Headline inflation is expected to fall again

Over the last year, headline inflation has been consistently falling in the US month over month. Today’s print is expected to show another drop with expectations of a 3.1% print which is down from the 4% prior.

Chart

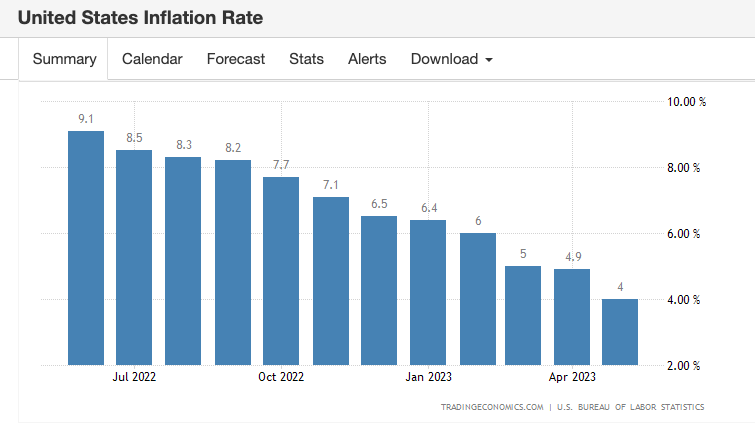
The core inflation print has remained stickier in the US, as it has throughout many other major Western economies. The current reading is 5.3% and that is expected to fall lower to 5%.

Chart

What’s likely to move markets

The financial source team has a handy economic data tracker tool that shows the minimum and maximum expectations for the data print. This is helpful in assessing which data releases are needed to surprise markets.

Chart

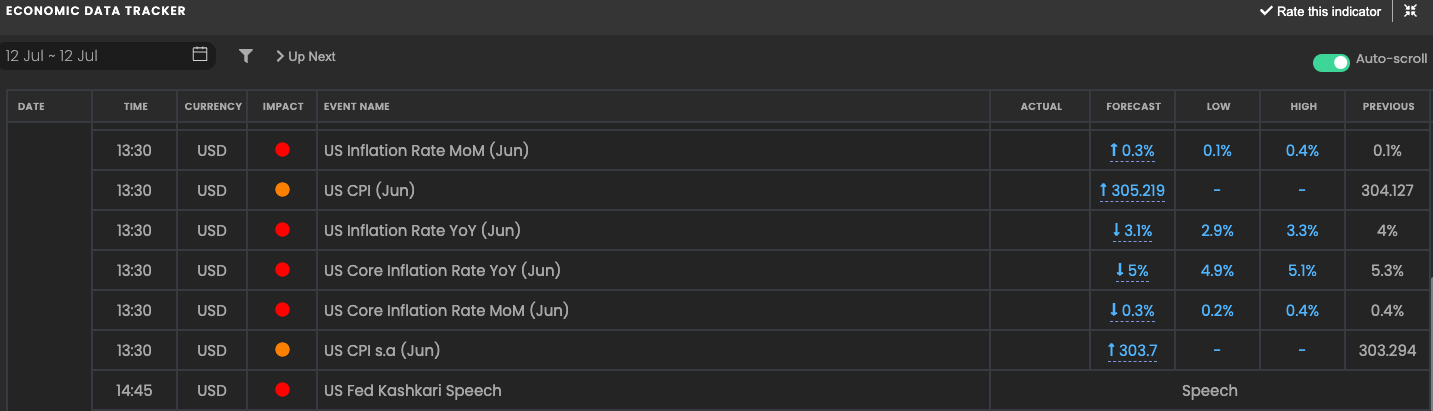
For the headline reading, a print below 2.9% and a core reading below 4.9% will both be below the minimum expected from the economists surveyed. In the case of a low print, investors will be carefully watching gold for potential gains. However, be aware that a lower CPI print has been expected all week, so a ‘buy the rumour, sell the fact response’ is also possible.

If the reading comes in above market expectations with a headline reading above 3.3% and a core reading above 5.1% then the USD could find strength again along with yields which would be a natural headwind for silver and gold. Note how gold is around a key daily trend line right now, and traders will likely use this as a reference point for risk. See it marked on the gold chart below.

XAUUSD

Learn more about HYCM


Author

Giles Coghlan LLB, Lth, MA

Giles is the chief market analyst for Financial Source. His goal is to help you find simple, high-conviction fundamental trade opportunities. He has regular media presentations being featured in National and International Press.

More from Giles Coghlan LLB, Lth, MA
Share:

Editor's Picks

AUD/USD falls to near 0.7100 after slipping below 50-day EMA

AUD/USD depreciates after registering minor gains in the previous day, trading around 0.7120 during the Asian hours. The technical analysis of the daily chart shows the pair consolidating sideways within a rectangle pattern, as neither bulls nor bears gain control. The AUD/USD pair is holding a slight bearish tone however as it sits beneath both the nine-day and 50-day EMAs.

USD/JPY coiling up around 160.00 amid 'Yentervention' threats

USD/JPY sits glued near 160.00 in Asia on Friday, as the Japanese Yen remains supported by persistent 'Yentervention' threats by Japan's officials. However, the pair's downside remains capped by the Mideast tensions-led risk-off mood and the US Dollar's bullish consolidation.

Gold returns to the red, awaits US NFP

Gold price is looking to test the weekly lows, while in the red near $4,450 in the early European session on Friday. The precious metal remains vulnerable amid ongoing geopolitical turmoil. Traders will closely monitor the developments surrounding the US-Iran peace deal and the US May employment report later on Friday.


Indian Rupee jumps as RBI holds, but unveils measures to boost foreign inflows

The Reserve Bank of India held the Repo Rate at 5.25%, as widely expected, on Friday. But the central bank unveiled various measures to boost foreign inflows into the economy, lifting the Indian Rupee against the US Dollar.

Top 3 Price Prediction: Bitcoin eyes $60,000, Ethereum risks $1,750, XRP could test $1

Bitcoin, Ethereum, and Ripple prices edge lower on Friday, extending a steady decline of roughly 15% so far this week. Institutional outflows weigh on Bitcoin and Ethereum while XRP largely follows the broader market trend.

Recession on paper: What really moves the Canadian Loonie now?

Statistics Canada handed the headline writers a gift and the analysts a headache. Real GDP shrank 0.1% on an annualized basis in the first quarter, and with the fourth quarter of 2025 revised down to a 1.0% contraction, that is two negative quarters in a row, the textbook definition of a technical recession and Canada's first since the pandemic.