The smart money might finally put their money where their mouths are in crude Oil

We monitor commodity market positioning and sentiment almost as much as we chart prices. We’ve witnessed an unusual conundrum; the spread between the market sentiment of industry insiders and the net long futures market position held in crude oil is unsustainably wide. Specifically, according to the Bullish Consensus Sentiment Index, about 70% of those polled are bullish crude oil. Nonetheless, the COT (Commitments of Traders) Report issued by the CFTC (Commodity Futures Trading Commission) suggests that a mere 250,000 net long contracts are currently being held. This is substantially below the half-a-million contracts held last year and, even more so, below the 750,000 all-time high net long position. If the so-called “smart money” decided to put their money where their mouths are, oil could see $92.00 per barrel, at minimum, and possibly even reach the low triple digits!
Seasonally, the oil market has a tendency to peak in mid-to-late October, so that leaves multiple weeks of seasonal support. Further, we are still burning off the fumes of the 2020 COVID stimulus and liquidity injection campaigns; higher fuel prices haven’t hurt the travel industry. I’ve been traveling for work and pleasure; I can attest flying in 2023 is not the same as in 2019. Lost luggage, delayed flights, canceled flights, and other inconveniences are expected obstacles, not outliers, yet there are butts in seats. In fact, TSA data reports record traffic!
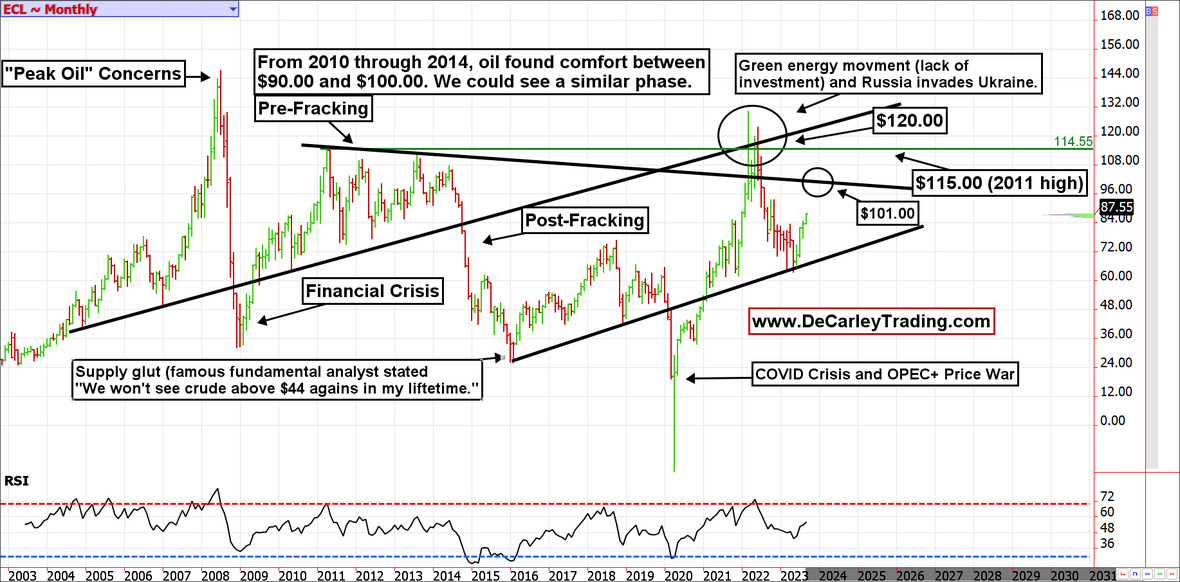
Monthly Crude Oil Futures
Revisiting the monthly oil chart, it is clear that prices held an uptrend line that dates back to the 2016 low (COVID shutdowns and an OPEC+ price war temporarily and violently breached this trendline). We see a similar downtrend line that dates back to 2010 (the Russian invasion of Ukraine temporarily and violently breached this trendline); this line comes in near $101.00 and will likely act as a price magnet. Confirming this idea is an RSI (Relative Strength Index) oscillator pointing higher with plenty of room to run before the market could be considered overbought.
Weekly Crude Oil Futures
Like the monthly chart, the weekly chart of oil futures suggests a move to $101.00 is in play. Weakness earlier this year found support near the 200-day moving average and pushed prices into what we believe is an equilibrium range between $75.00 and $101.00. According to our charts, this is the natural price range that likely would have existed if the black swan events from 2020 through 2022 were removed.
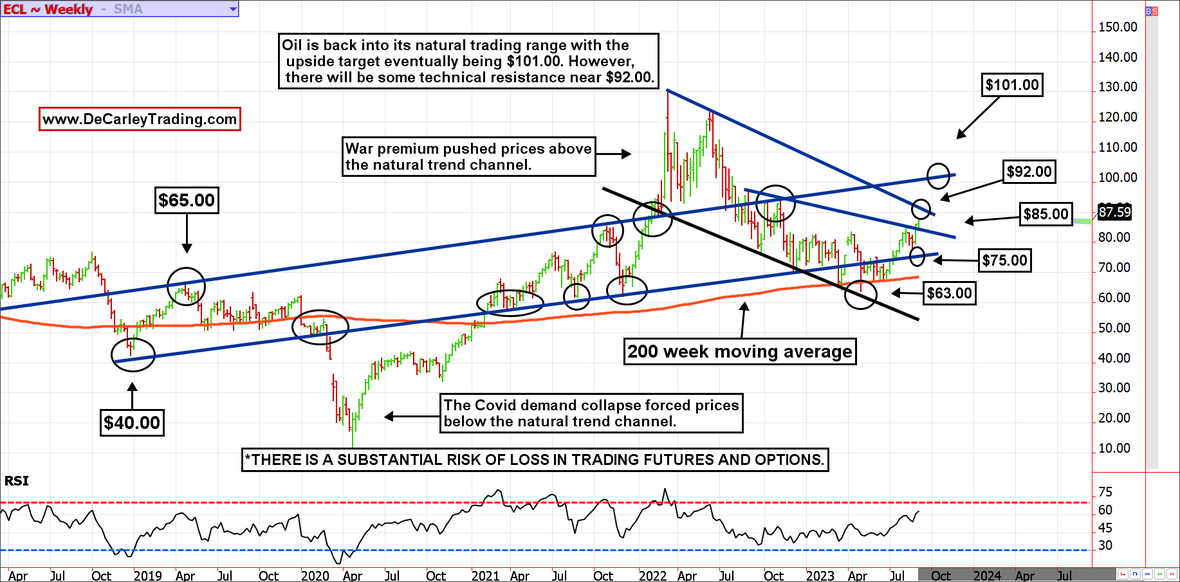
We suspect some rough waters near $92.00 based on a sharp downtrend line stemming from the 2022 top. Still, if the pessimism over China’s economic data dissipates and interest rates stabilize, triple-digit crude oil is likely (in our humble opinion).
Author

Carley Garner
DeCarley Trading
Carley Garner is an experienced commodity broker with DeCarley Trading, a division of Zaner, in Las Vegas, Nevada. She is also the author of multiple books including, “Higher Probability Commodity Trading” and “A Trader's First Book on Commodities”.


