The Short Volatility Trade Implodes - A "2018 Flash Crash" Post-Mortem

After yesterday's shocking implosion in the stock market, many US traders were no doubt surprised to see the sun rise this morning. All told, the widely-followed Dow Jones Industrial Average collapsed by 1,179 points, its largest ever drop in absolute point terms. At one point during the afternoon, the index shed 700 points in less than 5 minutes and was trading down nearly 1,600 points overall!
While the absolute point drop will garner all the headlines on the evening news, it's worth noting that the move wasn't nearly as dramatic on a percentage basis; yesterday's 4.6% decline in the Dow was just the 108th worst decline in the index since 1900 (h/t Michael Batnick). Put another way, the stock market has, on average, seen a similar drop about once per year over the last 117 years.
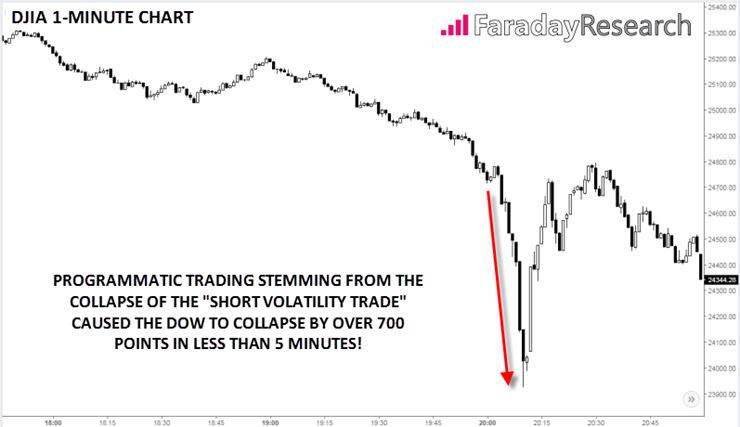
Source: TradingView, Faraday Research
So what caused the big selloff?
In a complex adaptive system like a capital market, it's impossible to identify a single catalyst for any market move, much less a dramatic collapse like the one we saw yesterday. That said, a number of factors combined to make the market particularly prone to an abrupt reversal:
Sentiment toward stocks was reaching euphoric levels, and the broad indexes were severely overbought. Indeed, the weekly relative strength index (RSI) recently hit its highest level ever.
Signs that US wage growth was finally perking up meant that the cost of hiring and retaining employees may hurt corporate profits moving forward.
Fixed income traders were increasingly convinced that the Fed would increase interest rates aggressively this year, driving up interest rates. This concern was exacerbated by fears of a "policy misstep" following this week's leadership change atop the central bank.
The escalating political tension in the US following the release of the "Nunes Memo" raises the risk of a "constitutional crisis" (to say nothing of another impending government shutdown).
These factors certainly set the stage for a destabilizing move, but the most direct catalyst for yesterday's freefall was the collapse of the overcrowded "short volatility trade." Traders of all stripes, from global fund managers (see below) to grocery store employees had piled into the "short volatility trade," betting that the tame conditions that prevailed through last year would continue.
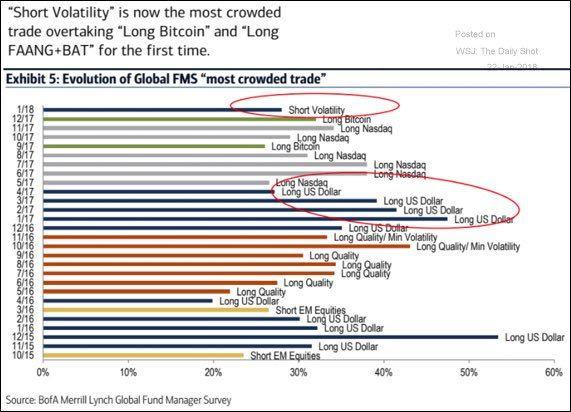
Source: Bank of America Merrill Lynch, Wall Street Journal
The issue with this trade is that it's the prototypical example of "picking up pennies in front of a steamroller." The primary way that many traders expressed this trade was through exchange traded notes (ETNs) like XIV and SXVY, which essentially sell longer-dated futures on the Volatility Index (VIX)... which is itself derived from the volatility of options on the S&P 500... which are primarily derived from the recent volatility in the price action of the market itself. In other words, traders were, often unwittingly, aggressively trading a derivative (the VIX futures) of a derivative (the VIX itself), of a derivative (options implied volatility), of a derivative (the price changes in the S&P 500), with each derivative layer adding an element of leverage to the trade.
In a calm market environment like the one we had seen over the last year, this structure meant that short volatility products like XIV made consistent profits, albeit with the unseen risk of a complete meltdown if market volatility rose sharply. That's exactly what we saw yesterday, and it's no surprise that Credit Suisse, the ultimate sponsor of XIV, just announced that it would be terminating the ETN later this month, with "investors" likely to get just pennies on the dollar.
To oversimplify the transmission mechanism to market prices, the dramatic increase in volatility prompted certain strategies (namely annuity and so-called risk parity funds) to automatically sell stocks to reduce overall risk. Reminiscent of the new-fangled "portfolio insurance" strategy exacerbating the Black Monday collapse in 1987, the feedback loop (selling pressure => falling prices => rising volatility => more selling pressure...) accelerated out of control yesterday afternoon.
So what's next?
The fact that traders and financial media have settled on a primary "bogeyman" behind the meltdown is actually a good thing for stock market bulls.
For many traders, the scariest part of yesterday's collapse was that no one could figure out what exactly was causing it. Now that there's a narrative to explain the move (even if it's not necessarily complete or all-encompassing), investors will feel more comfortable dipping their toes back into unrelated segments of the market. As Adam Button at ForexLive noted, now that traders can wrap their heads around the scope of the issue, "it's suddenly much easier to get back to buying shares of [blue-chip stocks like] McDonald's, Microsoft and 3M." For this reason, we believe the markets are likely past the "peak panic" stage, though that's not to say that they can't fall further in the coming week.
"Plan the trade, trade the plan"
More broadly, this week's price action is a reminder that all market participants need to have a plan in place before entering any position and stick to that plan. Whether its buying more on the "dip" or cutting losses quickly as stocks turn lower, having a strategy mapped out in advance makes it much easier to take advantage when the market offers opportunities like these.
Author

Matt Weller, CFA, CMT
Faraday Research
Matthew is a former Senior Market Analyst at Forex.com whose research is regularly quoted in The Wall Street Journal, Bloomberg and Reuters. Based in the US, Matthew provides live trading recommendations during US market hours, c


