The Chart of the Week: Gold bugs awaiting their discount
- Gold prices rose in anticipation of a Biden victory, time to sell the fact?
- Bulls, in anticipation of a discount, seek out the market’s support structures for optimal entry.

The price of gold has been supported on the US election outcomes as the US dollar slides into the hands of the bear’s on what most would describe as an inevitable outcome.
In so much as the dollar was expected to fall, the strong gains in risk appetite could be tempered by various fundamentals from which the US elections have distracted investors from.
Therefore, and without necessarily presuming that the rally in gold, for the near-term, is over, it does justify the case for a downside correction for which rewards prudent bulls a discount in catching the next bullish impulse.
The following is a top-down analysis that illustrates where an optimal bullish entry could be derived in anticipation of a correction on the weekly and daily charts.
Monthly chart
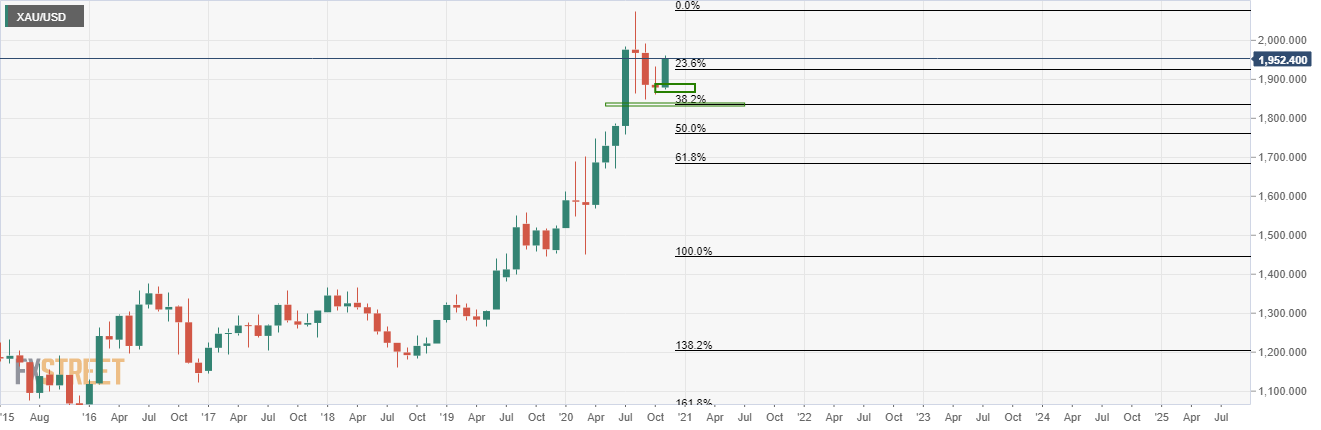
There is still room to the 38.2% Fibonacci retracement in what would be a complicated correction. However, the current support structure holds for the time being and opportunities to trade could be in place on the lower time frames.
Weekly chart
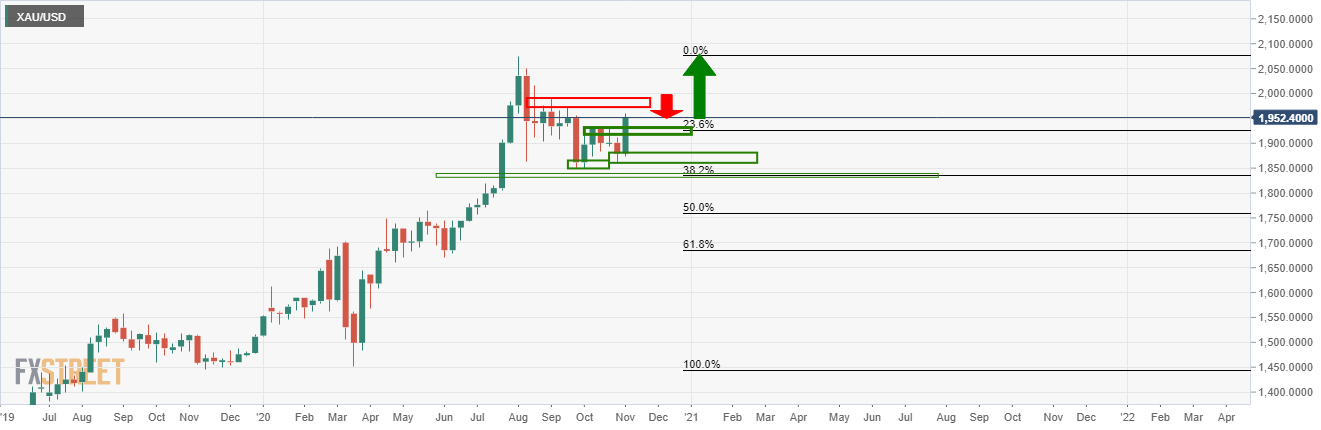
The price found support and rose to resistance which has now turned support following a higher low and subsequent break of the old resistance.
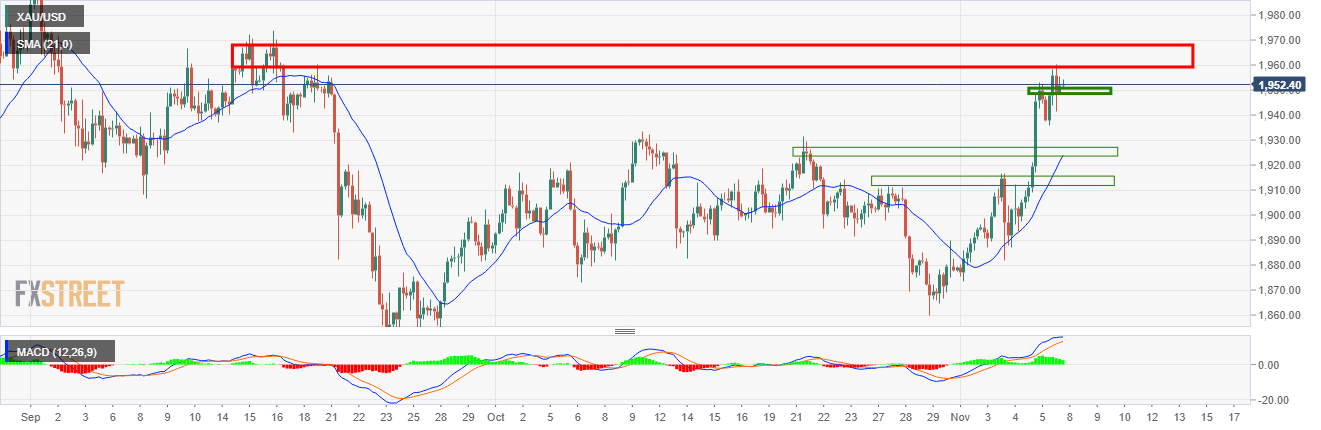
Daily chart
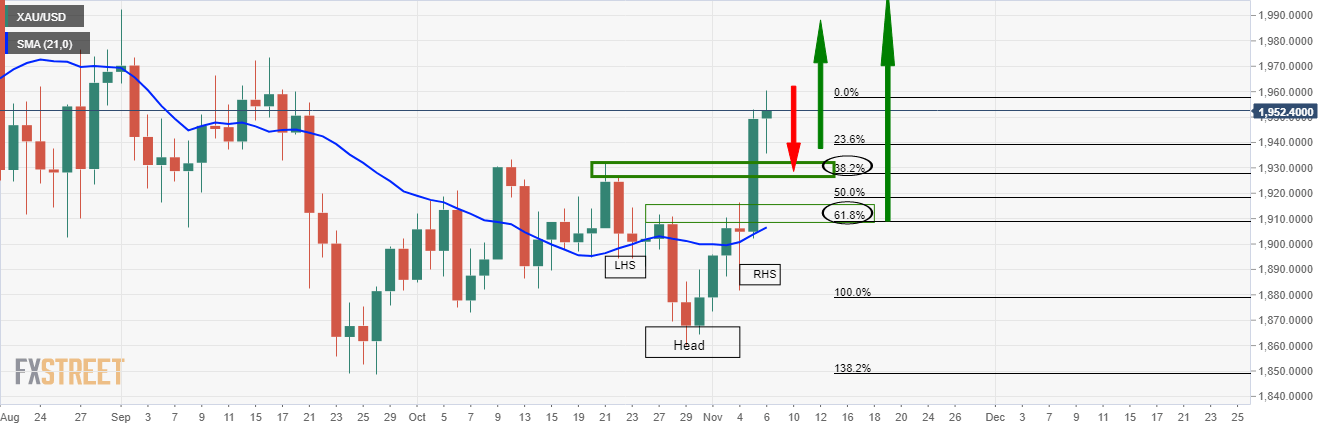
From a daily perspective, the price had completed a reverse head and shoulders in breaking the prior resistance.
On a pullback, the 38.2% Fibonacci has a confluence with the first layer of support and the 61.8% with the second and prior higher high which meets the 21-day moving average.
In anticipation of a bullish continuation, bulls could be prudent to first wait for a healthy correction to either of these two supports.
Should, however, the market continuation occur without a meanwhile correction, the weekly structure will be back in focus. A correction back to the weekly resistance would, therefore, be expected instead:
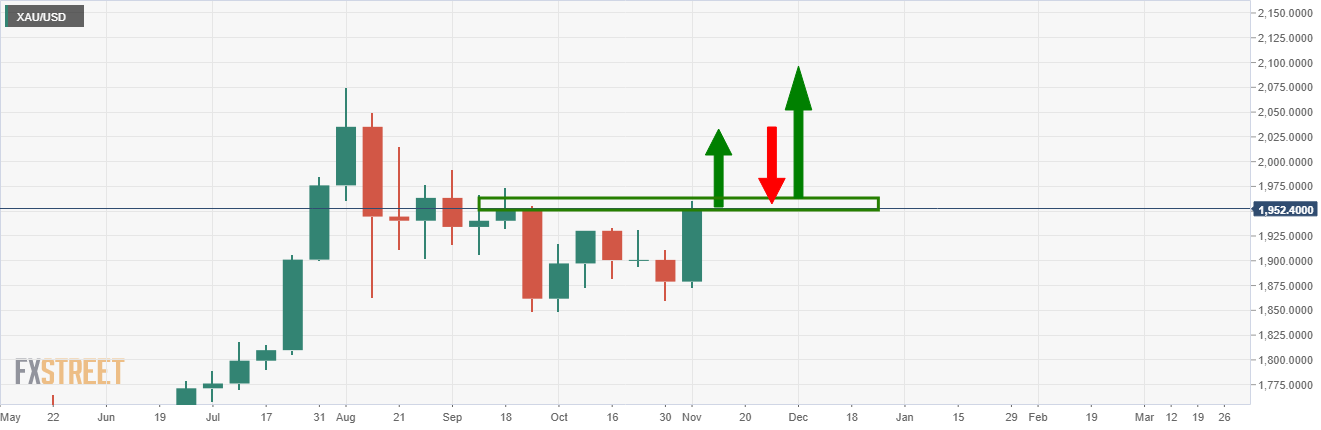
Any such price action can be traded on a lower time frame, including, the 4-hour chart from where optimal trade entries can be monitored, according to either bullish or bearish technical conditions.
The current environment remains bullish, so there is nothing to be done at this stage, for it is never wise to buy at resistance.
Premium
You have reached your limit of 3 free articles for this month.
Start your subscription and get access to all our original articles.
Author

Ross J Burland
FXStreet
Ross J Burland, born in England, UK, is a sportsman at heart. He played Rugby and Judo for his county, Kent and the South East of England Rugby team.


