The buffet indicator is there a bubble? A look at Bitcoin and the AUD/JPY [Video]
![The buffet indicator is there a bubble? A look at Bitcoin and the AUD/JPY [Video]](https://editorial.fxstreet.com/images/Markets/Currencies/Crosses/AUDJPY/forex-australia-and-japanese-currency-pair-with-calculator-4780678_XtraLarge.jpg)
The bubble talk
For more than 12 months the speculation among investors has been rising consistently with valuations in the majority of markets.The further equities rise the more chatter I see and hear about bubble markets, comparisons to the dot-com era, and the Buffett indicator. I get it I really do, a quick look at the price to earnings, price to sales, and price to book ratios of pretty much any stock worth more than a dollar and you see some inflated numbers that bring a sense of doubt.
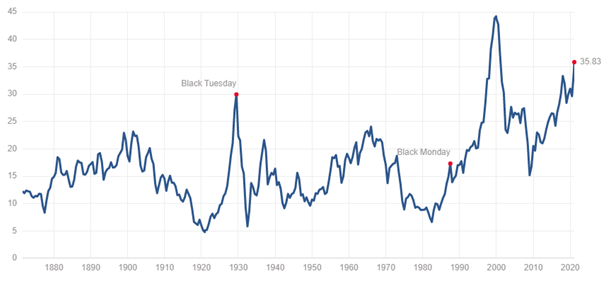
The Schiller Price to Earnings ratio (S&P500)
Price to Earnings ratio (S&P500)
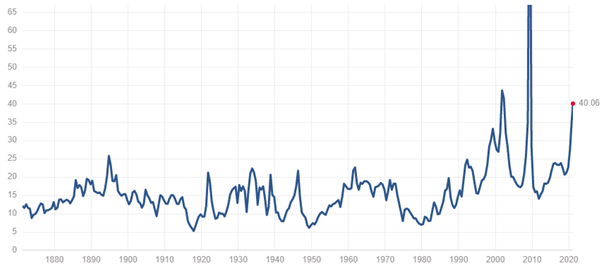
By looking at the variations of price to earnings it paints a compelling picture that a bubble is being generated in current equity valuations. A quick snapshot analysis it becomes bleeding obvious that the ratio is increasing at a rapid rate on par with the likes of the Global Financial Crisis and of the Dot Com Bubble.
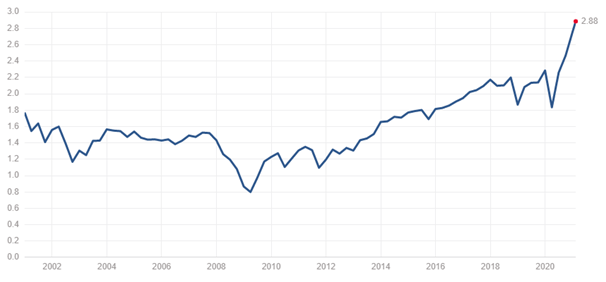
Price to Sales Ratio (S&P500)
The Price to Book Value (S&P500)
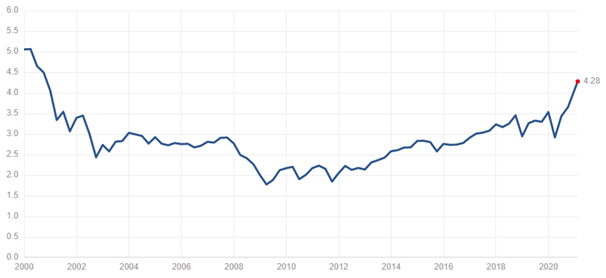
The scarier charts of the lot really come from the price to sales and price to book ratios.
Price to sales is the big bad having well a truly exceeded the stratosphere on its way to the moon. While its nice to revel in the current cycle of growth, it feels like it is the sweet spot for global equities.
These technical indicators have often forecast a bubble market in their history usually in tandem to the Buffett indicator. Much like inverted yield curves forecast the beginning of the end to economic expansion cycles, these ratio’s give an eerily similar result for bubbles.
The Buffett Indicator (Wilshire 5000 divided by GDP)
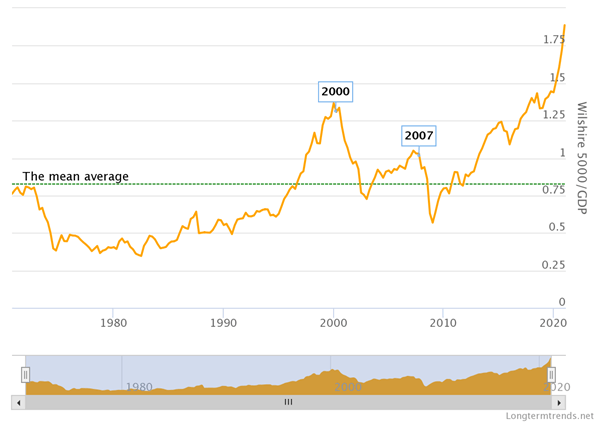
This brings me to the buffet indicator, the total of all US Stocks divided by the total Gross Domestic Product for the entire United States…at its highest level ever achieved since over five decades…
Does this mean that stocks are overbought, and valuations have overshot and are now running hot, pushing slowly into the needle? Not necessarily but it has my attention as a risk factor that needs to be considered constantly and that needs to be monitored as apart of my own trading.
Unfortunately, the key difference that clouds the judgement of these sorts of technical indicators is the blank cheque(s) that keep being rolled out through fiscal and monetary policy. While we have been exposed to both in the past, it has never been so many trillions globally or even country specific before now, this clouds the ability of these indicators to accurately present their data.
Even if the data is clouded, I am still going to heed the warning and hold and enter existing and new positions optimistically in the face of risk, but with a newly added daily routine.
In parting I will leave you with a warren Buffett quote for today’s blog.
(Be) “fearful when others are greedy, and greedy when others are fearful.” – Warren Buffett
Author

Alistair Schultz
Independent Analyst


