Technical outlook in key markets

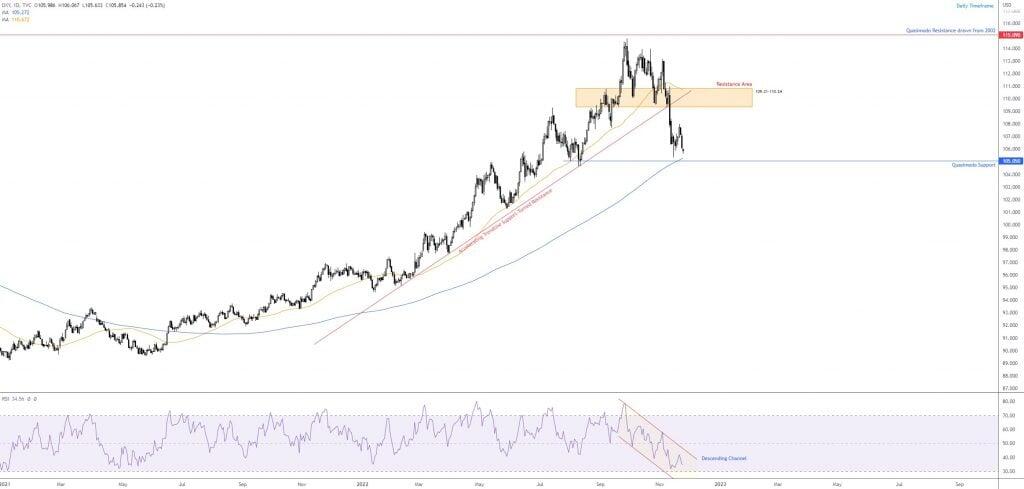
The US Dollar Index—measures the dollar’s value against six major currencies—finished lower for a third consecutive session on Thursday. This shines the technical spotlight on Quasimodo support coming in at 105.05, a base accompanied by the widely watched 200-day simple moving average (currently fluctuating around 105.27). Therefore, this, coupled with the relative strength index (RSI) nearing oversold space, remains a key technical zone to be mindful of going forward.
Relating to the greenback’s current trend, a number of lower lows/highs have emerged since price peaked at 114.78 in late September and indicates a downtrend. The caveat here, however, is the dominant uptrend in play since June 2021.
Consequently, as aired above, current support at 105.05 and the 200-day SMA is a key area. A break swings the technical pendulum in favour of further selling, in line with the downtrend. Alternatively, of course, a rebound from the aforementioned support area adds weight to buying, consistent with the longer-term uptrend we’ve seen since mid-2021.
Oil (WTI): Double-top profit objective in sight
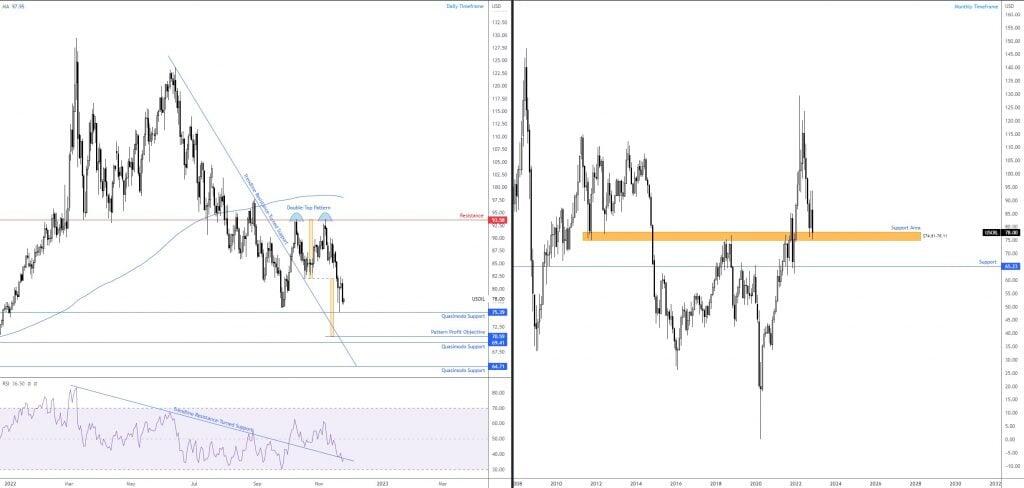
It has been quite the rollercoaster for oil prices in 2022. Year to date, WTI is trading 3.0% higher. This follows a heavy-handed ascent in Q1 and early Q2 to a high of $129.42, followed by a decline to near-unchanged levels in Q4.
Technically speaking, price action on the monthly timeframe is shaking hands with long-term support from $74.81-78.11. The month of October did witness price attempt to secure some grip from the aforementioned area, though slipped in November as price is poised to dethrone the zone and perhaps approach support from $65.23.
Noting that monthly support is potentially fragile, the daily timeframe forging a fresh lower low and completing a double-top pattern from resistance at $93.58 is likely to draw attention. The neckline ($82.10) for the pattern experienced a breach last Friday, leading to a Quasimodo support level entering the fight at $75.39. Though considering the lacklustre bid seen from the level (the hammer candlestick reaction failed to persuade buyers and instead appears to have trapped those who entered on a buy-stop above the hammer pattern’s high), technical studies suggest further selling could be on the table in this market. This is corroborated by the non-existent response from the relative strength index (RSI) trendline resistance-turned support, taken from the high 83.24.
Therefore, a break of $75.39 on the daily scale could inspire breakout selling in the direction of $70.59.
AUD/USD: Higher price levels?
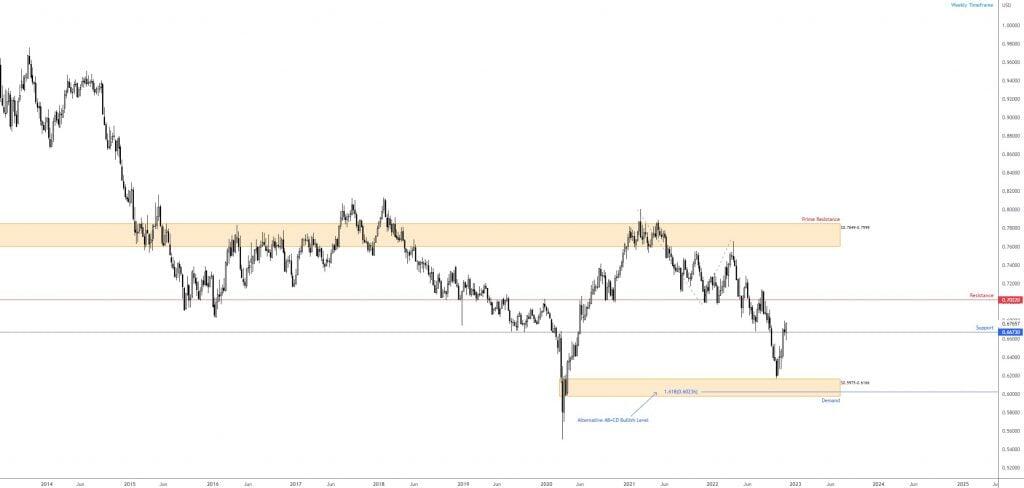
Week to date, the AUD/USD has rallied 1.4%. This is bolstered by a resistance-turned support on the weekly timeframe at $0.6673. Should further outperformance materialise, weekly resistance is at $0.7022, with a break of here possibly unlocking the door to prime resistance at $0.7849-0.7599. Therefore, although the price on the weekly chart remains within a downtrend, technical structure shows support for additional buying.
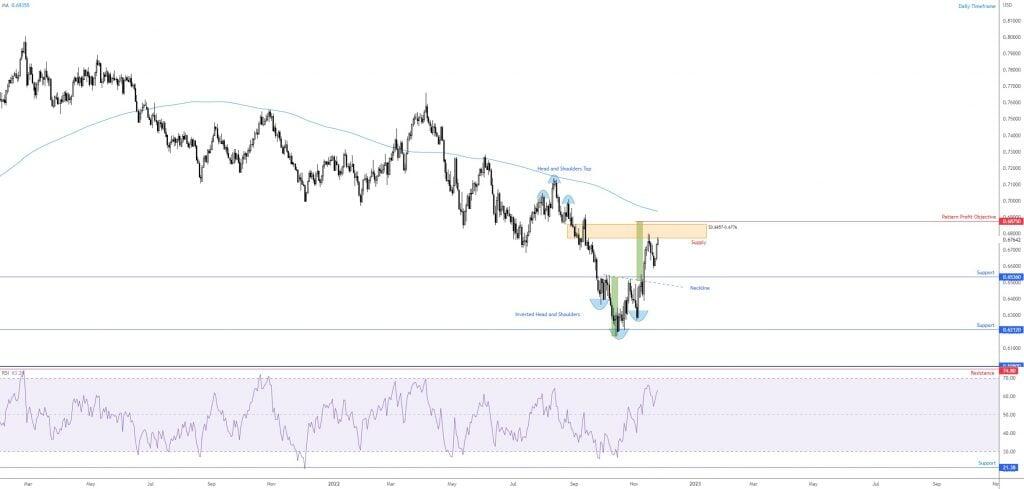
From the daily timeframe, knowing that the weekly timeframe indicates further upside is in the offing, supply from $0.6857-0.6776 is in a vulnerable location.
In recent writing, the research team underlined an inverted head and shoulders pattern ($0.6363; $0.6170; $0.6272) as a possible reversal signal. Since then, the pattern’s neckline, pencilled in from the high $0.6547, was breached as was resistance from $0.6536 (now a marked support). As noted above, supply is in the firing range, and a break could lead to the double-top pattern’s profit objective making a show at $0.6875, a level sheltered just south of the 200-day simple moving average at $0.6936.
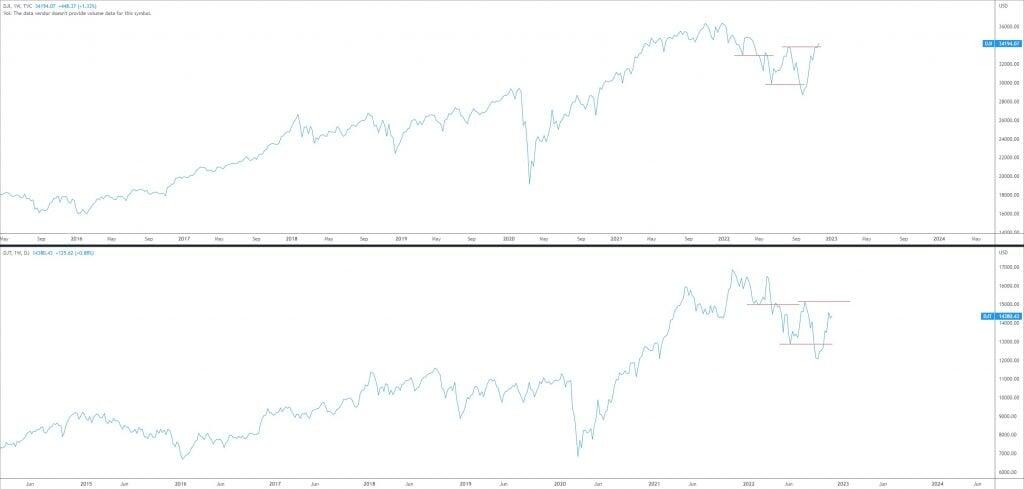
Dow Theory: Uptrend?
Weekly timeframe
Using the weekly closing prices of the Dow Jones Industrial Average (DJIA) and the Dow Jones Transportation Average (DJTA covers 20 stocks in the transportation industry using a price-weighted method), we can see the DJIA forged a higher high in recent trading, yet this remains unconfirmed on the DJTA.
Should the above come to fruition: DJTA establishes a higher high, a pullback in one of the averages of at least 3-4% would need to form in one of the averages according to Dow Theory. Following this, only when a break of the previous high on both averages is seen will an uptrend be confirmed.
Author

Aaron Hill
FP Markets
After completing his Bachelor’s degree in English and Creative Writing in the UK, and subsequently spending a handful of years teaching English as a foreign language teacher around Asia, Aaron was introduced to financial trading,


