Stocks hammered with the Nasdaq plunging again as liquidity dries up

The Dow fell over 800 points and the Nasdaq fell 4% intraday with all the major indexes down at least 10% from their highs.
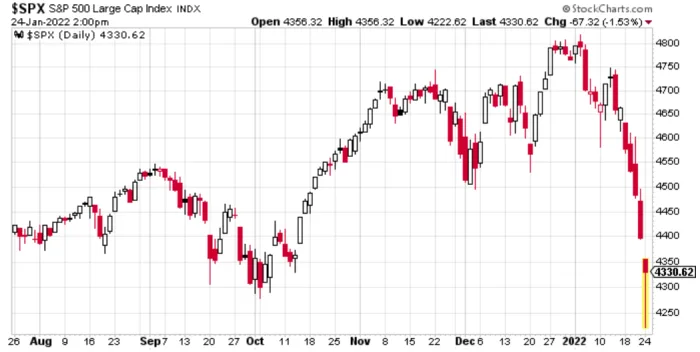
S&P 500 chart courtesy of Stockcharts.com.
All of the major indexes were hammered today but have recovered some of their losses as of 1:00 PM Central.
As I type now, at 1:50 Central stocks reversed lower.
Nasdaq Composite Index
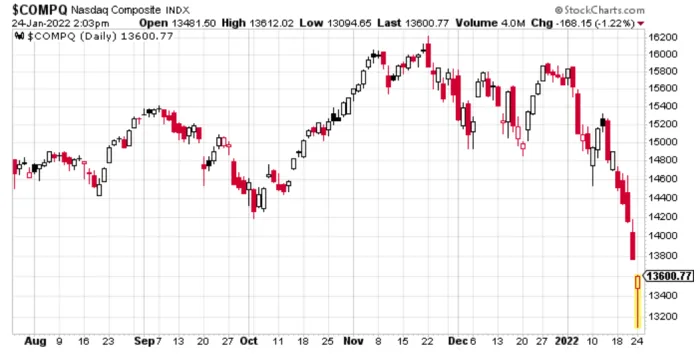
Nasdaq Composite Index courtesy of Stockcharts.com.
The DOW
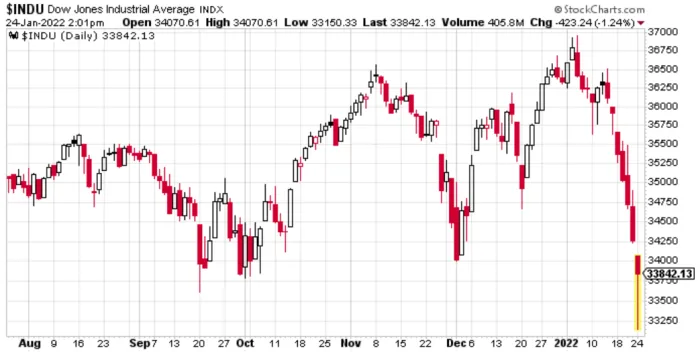
Dow Jones Industrial Index courtesy of Stockcharts.com.
There is now a vicious short covering rally underway and stocks closing green would not surprise me in the least.
Nor should anyone be surprised if stocks reverse back towards the lows.
Let's step back and look at longer term charts and the grand scheme of things.
S&P 500 Weekly
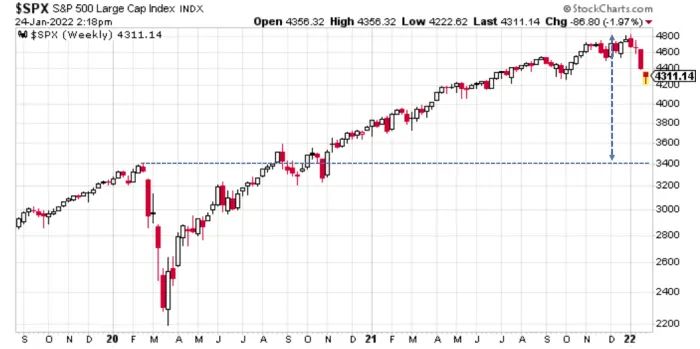
S&P 500 Weekly Chart courtesy of Stockcharts.com, annotated by Mish
A weekly chart shows stocks more than doubled from the pandemic low.
It would take another 900 point plunge on the S&P 500 just to get back to the pre-pandemic high.
Let's take an even broader view.
S&P 500 Monthly Chart
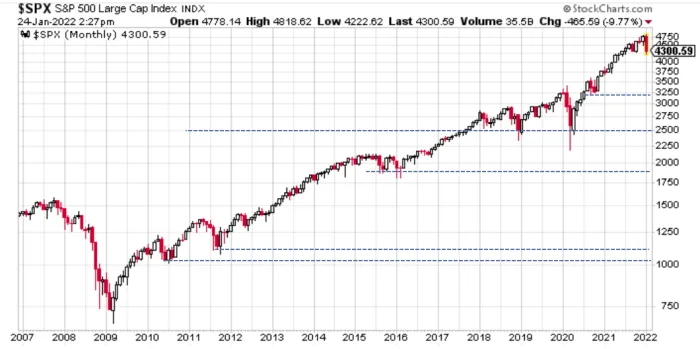
S&P 500 Monthly Chart courtesy of Stockcharts.com, annotated by Mish
The dashed lines show technical support levels.
Many millennials and Zoomers have no idea what a strong bear market feels like.
I believe we are headed for one courtesy of the Fed's cheap money coupled with three rounds of fiscal stimulus, one under president Trump and two under Biden.
Yep, I have been a bear for a long time. But the Fed had other ideas pumping massive amounts of QE and holding rates too low too long just as it did the 2000 dotcom bubble followed by the 2007 housing bubble.
By every measure, this bubble is bigger and more encompassing than the previous two.
A 40% decline from the tops is the bare minimum of what I expect. That's how insanely overvalued stocks are.
If so, this plunge from the January highs is barely a down pay on what's coming.
John Hussman has an excellent column this month called Return-Free Risk that I encourage everyone to read.
The question isn’t whether one should adapt to unprecedented Fed policies, but instead, the form those adaptations should take. We are fully convinced that these historic valuation extremes have removed decades of investment returns from the future, and strongly suspect that the Fed has amplified future downside risk as well. I believe investors have placed themselves in a position that is likely to be rewarded by a very long, interesting trip to nowhere over the coming 10-20 years. At worst, they may discover the hard way that a retreat merely to historically run-of-the-mill valuations really does imply a two-thirds loss in the S&P 500.
A Fed-Induced Speculative Bubble
The chart below shows how deranged Federal Reserve policy has become. I use that word advisedly: de-ranged as in wildly outside of historical bounds, and also deranged as in intellectually unsound. The most important issue facing the Fed here isn’t how quickly to taper its asset purchases, or when the next rate hike should occur. The real problem for the Fed is that it has completely abandoned any semblance to a systematic policy framework, in apparent preference for a purely discretionary one.
Monetary Base Per Dollar of Nominal GDP
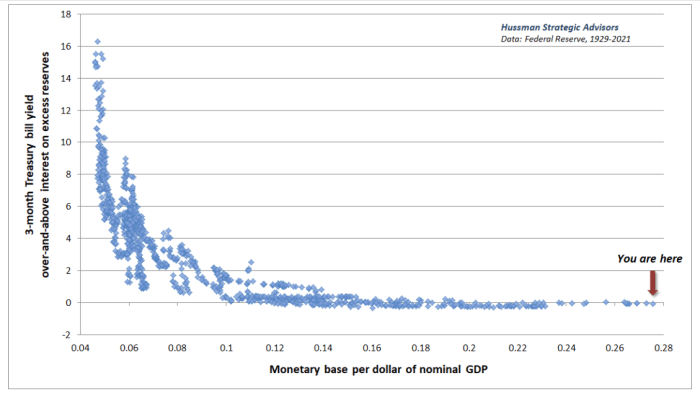
Monetary Base Per Dollar of Nominal GDP - Chart from HussmanFunds.Com
The current level of the monetary base relative to GDP is utterly at odds with Section 2A of the Federal Reserve Act, which instructs the Fed to “maintain long-run growth of the monetary and credit aggregates commensurate with the economy’s long run potential to increase production.” The ratio of base money to GDP never exceeded 16% before 2008. The nearest alternative to holding zero-interest base money is to hold a Treasury bill, and 16% of GDP in zero interest base money is already sufficient to drive T-bill rates to zero. Until the Federal Reserve contracts its balance sheet by half, the only way the Fed can raise short term interest rates above zero is by explicitly paying interest to banks on their excess reserves (IOER).
In case you missed it, also see my January 21 post S&P 500 Futures Positioning Suggests More Down is Coming.
Well, here we are.
Despite the selloff, fund managers and speculators are still hugely long futures, even adding more.
Hussman is accused of being a perma-bear and so am I. What's true is that we seek to above bubbles and this one has been spectacular.
Yet, my 40% decline scenario (at least) make me look like a raging optimist compared to John.
Thanks for Tuning In!
Author

Mike “Mish” Shedlock's
Sitka Pacific Capital Management,Llc


