Stocks are going sideways, is this a month-long bear flag pattern?

The S&P 500 index extended its short-term decline yesterday. Is this a new downtrend or still just a correction following last week’s breakout?
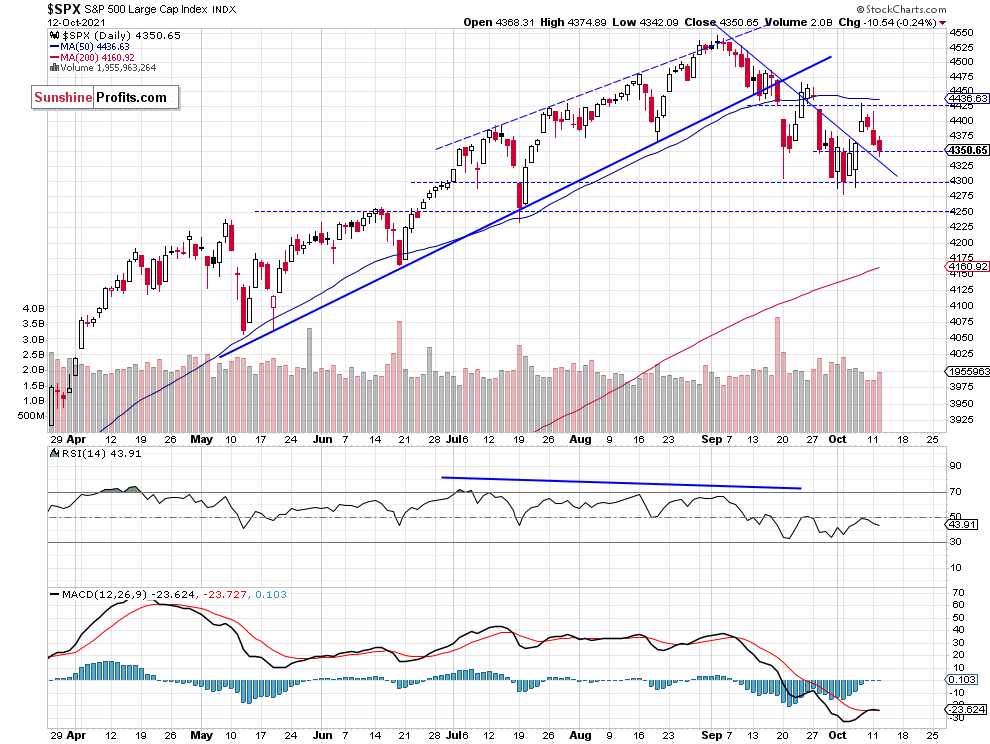
Stocks went slightly lower yesterday, as the S&P 500 index lost 0.24%. The broad stock market index got back to the 4,350 level. Investors were taking short-term profits off the table following last Thursday’s rally. It looks like a downward correction so far, as the index remains above the late Sep. - early Oct. consolidation. This morning the main indices are expected to open between -0.1% and +0.2% vs. their yesterday’s closing prices. So we may see a consolidation along the mentioned support level of 4,350 following today’s mixed Consumer Price Index number release.
The support level is now at around 4,350 and the next support level is at 4,300-4,320, marked by the recent local lows. On the other hand, the resistance level is at 4,400-4,420. The S&P 500 remains slightly above its month-long downward trend line, as we can see on the daily chart.
Dow Jones remains relatively weaker
Let’s take a look at the Dow Jones Industrial Average chart. The blue-chip index remains below its month-long downward trend line. So it is relatively weaker than the broad stock market. The nearest important resistance level is at 35,000 and the support level is at 33,800, among others, as we can see on the daily chart:

Apple is still at the crucial $142 price level
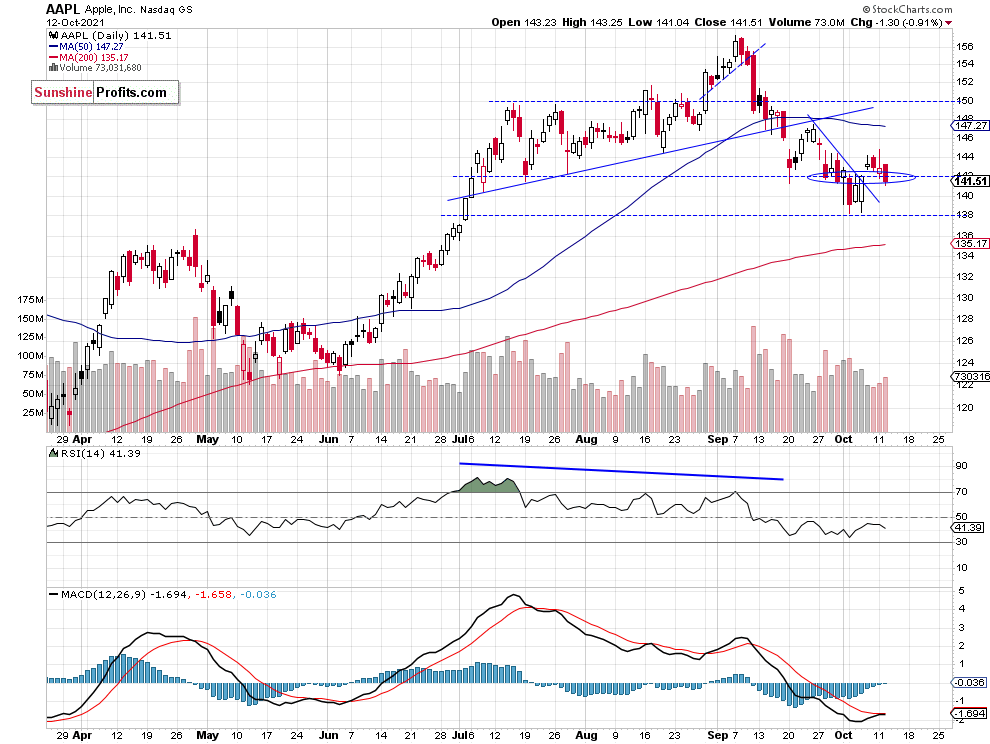
Apple stock weighs around 6.1% in the S&P 500 index, so it is important for the whole broad stock market picture. The stock continues to trade along the $142 price level. And on Monday it bounced from the resistance level of $144.
Is it better to stay out of the market right now?
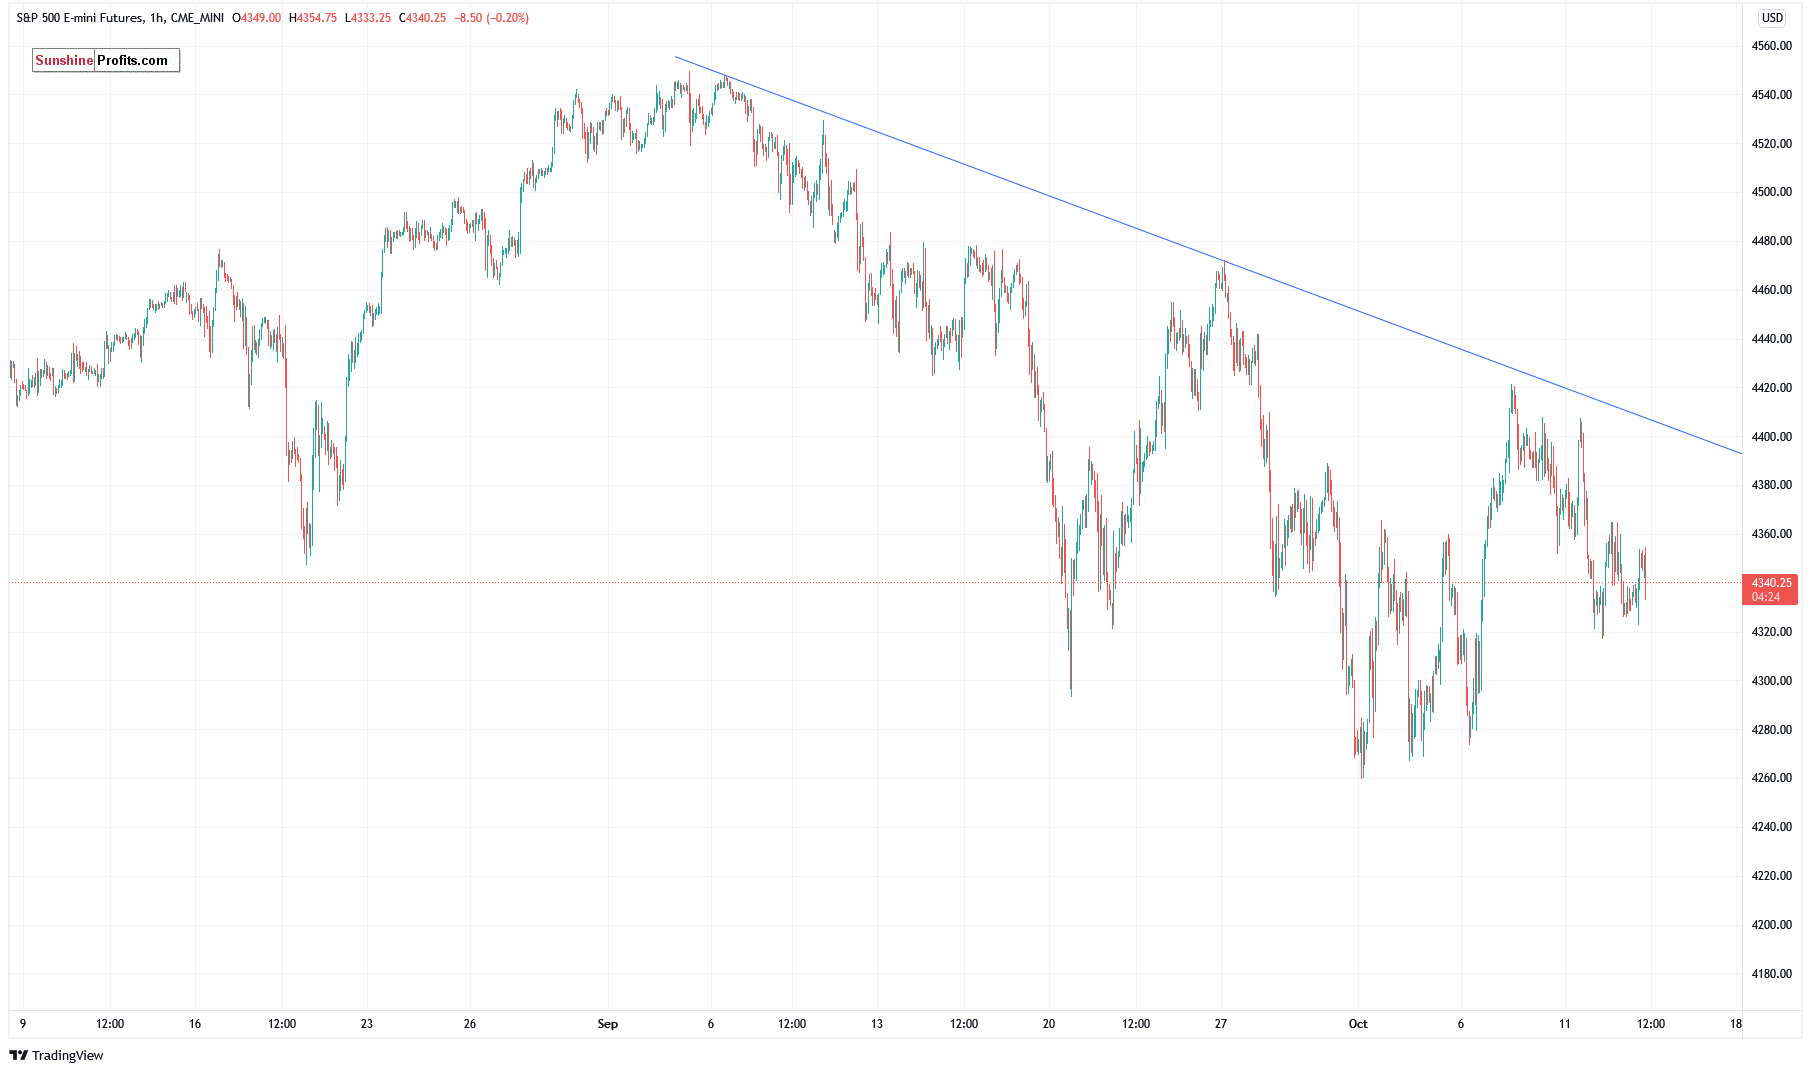
Let’s take a look at the hourly chart of the S&P 500 futures contract. The market bounced back from the 4,400 level on Monday and now it is trading within a consolidation along the 4,350 level. The support level is at 4,260-4,300, and the downward trend line is at 4,400. In our opinion no positions are currently justified from the risk/reward point of view.
Conclusion
The S&P 500 index slightly extended its short-term downtrend on Tuesday, as investors awaited today’s CPI number release, among other factors. It came back to the 4,350 level after bouncing from the 4,400 level once again on Monday. We may see some more short-term uncertainty and the market will most likely extend its almost a month-long consolidation here.
The risk/reward perspective seems less favorable right now and no positions are currently justified.
Here’s the breakdown:
-
The S&P 500 broke above its consolidation last week, but for now it looks like an upward correction within an over month-long downtrend.
-
We are still expecting more downward pressure and a correction to 4,200-4,250 level.
Want free follow-ups to the above article and details not available to 99%+ investors? Sign up to our free newsletter today!
Want free follow-ups to the above article and details not available to 99%+ investors? Sign up to our free newsletter today!
Author

Paul Rejczak
Sunshine Profits
Paul Rejczak is a stock market strategist who has been known for the quality of his technical and fundamental analysis since the late nineties.


