Briefly: In our opinion, no speculative positions are justified.
Our intraday outlook is neutral, and our short-term outlook is neutral. Our medium-term outlook remains bearish, as the S&P 500 index extends its lower highs, lower lows sequence:
Intraday outlook (next 24 hours): neutral
Short-term outlook (next 1-2 weeks): neutral
Medium-term outlook (next 1-3 months): bearish
Long-term outlook (next year): neutral
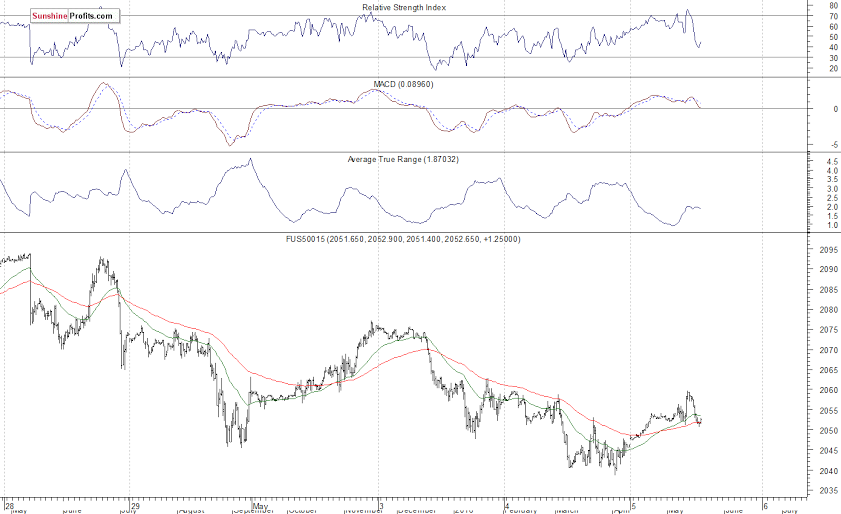
The U.S. stock market indexes lost 0.6-0.7% on Wednesday, extending their short-term downtrend, as investors reacted to economic data releases, among others. The S&P 500 index remains close to its support level of 2,050. The next important level of support is at around 2,030-2,035, marked by some previous local lows. On the other hand, resistance level is at 2,070-2,075, marked by the recent consolidation. The next level of resistance remains at 2,100-2,115, marked by medium-term local highs. Is this the end of two-month long uptrend? Or is this just correction before another leg up reaching last year's all-time high? Last year's highs along the level of 2,100 continue to act as medium-term resistance level, as we can see on the daily chart:

Expectations before the opening of today's trading session are positive, with index futures currently up 0.2-0.3%. The European stock market indexes have been mixed so far. Investors will now wait for the Initial Claims data release at 8:30 a.m., along with tomorrow's Monthly Nonfarm Payrolls number announcement. The S&P 500 futures contract trades within an intraday consolidation, following a rebound off yesterday's low at around 2,040. The nearest important level of resistance is at 2,060, marked by local highs, and support level is at 2,040. The market extends its slightly descending short-term trading channel, as we can see on the 15-minute chart:
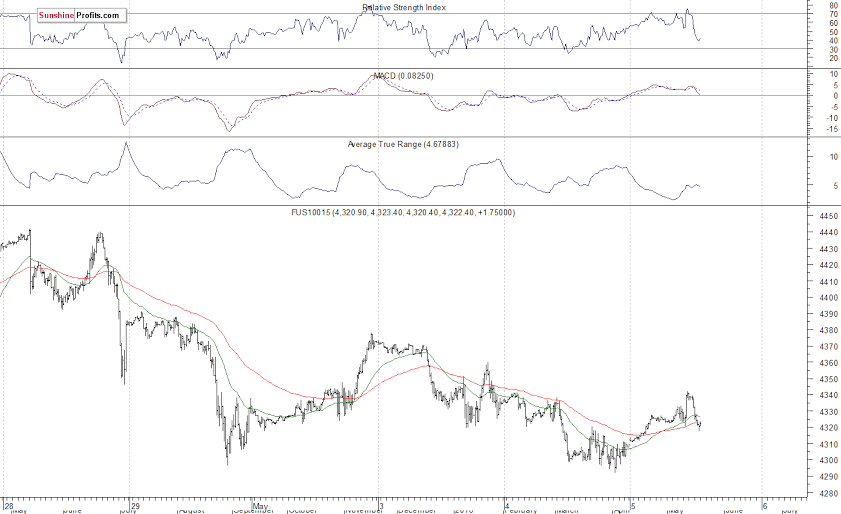
The technology Nasdaq 100 futures contract follows a similar path, as it currently trades above the level of 4,300. The nearest important level of resistance is at 4,340-4,350, marked by recent local highs. The nearest important support level is at 4,290-4,300, as the 15-minute chart shows:
Concluding, the broad stock market slightly extended its short-term downtrend on Wednesday. Is this just a downward correction following over two-month long rally or new medium-term downtrend? The S&P 500 index continues to trade above its late March - early April local lows. For now, it looks like a downward correction, so we prefer to be out of the market, avoiding low risk/reward ratio trades. We will let you know when we think it is safe to get back in the market.
All essays, research and information found above represent analyses and opinions of Przemyslaw Radomski, CFA and Sunshine Profits' employees and associates only. As such, it may prove wrong and be a subject to change without notice. Opinions and analyses were based on data available to authors of respective essays at the time of writing. Although the information provided above is based on careful research and sources that are believed to be accurate, Przemyslaw Radomski, CFA and his associates do not guarantee the accuracy or thoroughness of the data or information reported. The opinions published above are neither an offer nor a recommendation to purchase or sell any securities. Mr. Radomski is not a Registered Securities Advisor. By reading Przemyslaw Radomski's, CFA reports you fully agree that he will not be held responsible or liable for any decisions you make regarding any information provided in these reports. Investing, trading and speculation in any financial markets may involve high risk of loss. Przemyslaw Radomski, CFA, Sunshine Profits' employees and affiliates as well as members of their families may have a short or long position in any securities, including those mentioned in any of the reports or essays, and may make additional purchases and/or sales of those securities without notice.
Recommended Content
Editors’ Picks
EUR/USD holds positive ground above 1.0750 ahead of Eurozone PMI, PPI data

EUR/USD trades in positive territory for the fourth consecutive day near 1.0765 during the early Monday. The softer US Dollar provides some support to the major pair. Traders await the HCOB Purchasing Managers’ Index (PMI) data from Germany and the Eurozone, along with the Eurozone PPI.
GBP/USD rises to near 1.2550 due to dovish sentiment surrounding Fed

GBP/USD continues its winning streak for the fourth consecutive day, trading around 1.2550 during the Asian trading hours on Monday. The appreciation of the pair could be attributed to the recalibrated expectations for the Fed's interest rate cuts in 2024 following the release of lower-than-expected US jobs data.
Gold price rebounds on downbeat NFP data, softer US Dollar

Gold price snaps the two-day losing streak during the Asian session on Monday. The weaker-than-expected US employment reports have boosted the odds of a September rate cut from the US Federal Reserve. This, in turn, has dragged the US Dollar lower and lifted the USD-denominated gold.
Bitcoin Cash could become a Cardano partnerchain as 66% of 11.3K voters say “Aye”

Bitcoin Cash is the current mania in the Cardano ecosystem following a proposal by the network’s executive inviting the public to vote on X, about a possible integration.
Week ahead: BoE and RBA decisions headline a calm week

Bank of England meets on Thursday, unlikely to signal rate cuts. Reserve Bank of Australia could maintain a higher-for-longer stance. Elsewhere, Bank of Japan releases summary of opinions.