SP500 Trend Down, Gold Up

SP500
For the SP500, cycle-wise November 4th was the Primary cycle trough. 1 which puts us entering the 13th week of a nominal 18 week cycle. Nov. 4th was the 40 week cycle trough as well. The 1st Half 2017 Forecast dates are estimated from Astrological events only. As time unfolds we have the benefit of market cycles and possibly additional Astrological events. Nevertheless the original dates have fared very well. See the blog post of December 11, 2016, showing the original forecast dates for the SP500. These are the original 6 month dates with no adjustments for the last 3, 6 month periods.
It should be noted Primary cycles (18 weeks) most often start with a nominal 6 week sub-cycle. The 2nd most common start is a 1/2 Primary or 9 week sub-cycles.
We are about to enter a stressful period of time. This includes 2 Eclipses, a Lunar next week then a Solar eclipse later in the month. Both aspect Mars. This period also includes Pluto sesquisquare the North Node, Mars squaring Pluto, Mars conjunct Uranus, Mars opposition Jupiter. the Sun conjunct Neptune, Jupiter opposition Uranus and the Venus retrograde.
This could potentially cause significant problems in the stock market and other areas of life (i.e. earthquakes, violent weather, conflict) . The eclipses look difficult, especially the Solar eclipse in August. Subscribers have the dates and further information on these events. Keep watching. February looks rough but March and the first half of April look worse.
The next estimated Primary cycle ( aka nominal 18 week cycle) low is estimated to be March 6th +- 3 weeks with a range of February 13th, 2017 to March 19, 2017. It could also be the week of March 19, 2017 +- 3 weeks. As we get closer I will use the upcoming Astros and market cycles to try and get a more exact reading on when the Primary cycle trough will occur. Early April is another possibility.
The March 6, 2017 forecast was first mentioned in our blog post of November 14, 2016.
I mention this again as early March is looking more and more like a low and we are getting close to a change in trend which will be down.
On the evening of February 6th Jupiter will turn retrograde. The Jupiter retrograde is often found at highs and lows.
I'm looking for a turn down by February 6th +- 5 tds.
The Cycle chart mentioned last week resulted in three down days.
Mars is active and we have 2 eclipses in February. A Lunar eclipse on February 10th at 22'Leo28" and a Solar eclipse on February 26th at 8'Pisces12" Eclipses are powerful events that can effect events months before and after the exact eclipse date. Subscribers will have details of these eclipses and 2 more in August. August looks worrisome due to possible geophysical events which could occur. This coming month could have geophysical events as well as Mars is active and will be in aspect to all 4 eclipses that will occur this year. Mars is the planet of war, conflict and aggression.
On March 7th +- 3 td's, Saturn conjuncts the Galactic Center. The 2 week period could define another move down. This may be very important. Bear in mind we are in an 8 year bull market. A move down could start at any time, the above are the most probable from an Astrological perspective.
As mentioned in previous weeks both Israel and Egypt (mid-East) may come to the fore this year as regards to conflict and aggression. This may be seen before the end of April. This is connected to the on-going Saturn/Uranus trine, a 45 year aspect which is exact again on May 19th.
The next Jupiter / Uranus opposition (2nd of a 3 pass) will next occur on March 2nd.
Mar 4 Venus retrograde (could be very important)
The second pass of the 14 year aspect, Jupiter opposing Uranus occurs on March 2nd. At times this opposition will be a T-square with Pluto at the Apex. The French Astrologer, Barbault considers this transit to be predominantly a capitalist oriented cycle. This transit could bring a spirit of collective optimism. This may be particularly opportune at this time with "The Donald" looking to improve the capitalist system which is the USA. Don't look for an immediate event. Look for a swing to the right politically. Revolutionary activity. This aspect has a history of market turns
As noted above the 2nd opposition of Jupiter and Uranus occurs March 2nd, two days before Venus turns retrograde. There is a Venus cycle which could be important. That is every 8 years or 5 Venus retro occurrences, Venus returns to approximately the same spot in the Zodiac. Venus turns retrograde on March 4th 2017. 8 years ago or 5 Venus retro occurrences Venus turned retrograde on March 6, 2009. This was the day of the low in the major US indices. If, for some reason, we do not get a change in trend in late January / early February then the March 4 date would be a good candidate for a turn.
The following chart shows Venus retrograde dates (retro, red arrow pointed left), Venus direct (blue arrow pointed right) and the Sun/Venus conjunct noted as Inferior or Superior, (I or S). Mercury and Venus are the two planets inside the Earth's orbit and the only one's that can have Inferior and Superior conjunctions with the Sun. The next conjunction is an Inferior conjunction. Note the previous Inferior conjuncts (I) on the following chart.
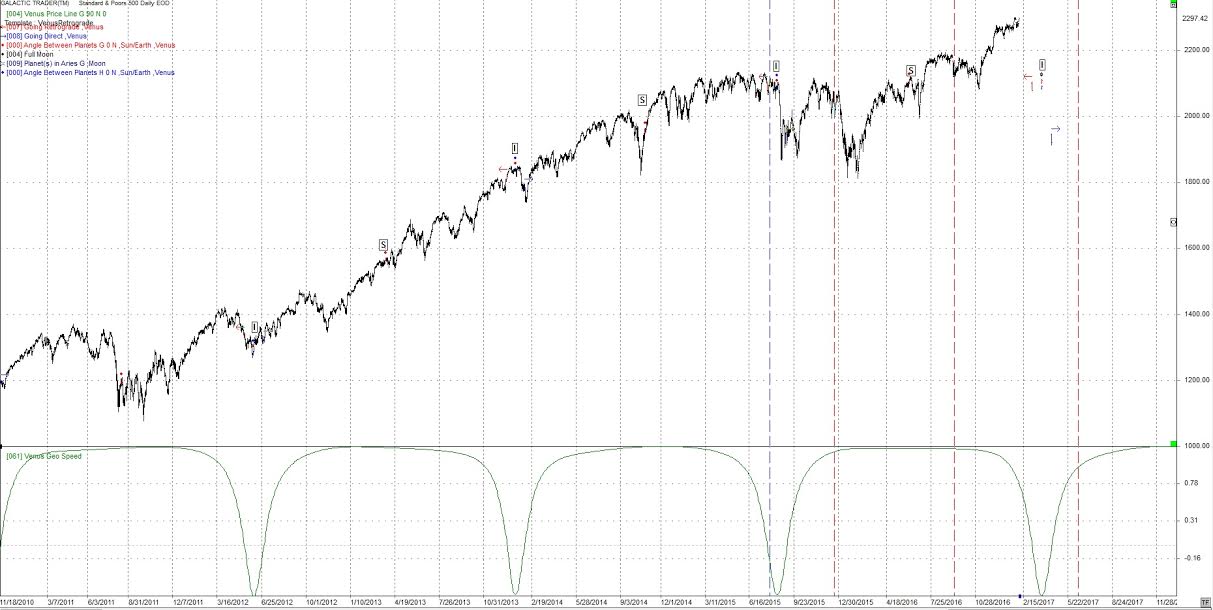
On the following chart the red vertical lines are a 45 td (trading days) cycle. Note they have been at a low then a high then repeat. Although slightly extended we should be looking for a low on the last red vertical line on March 14, 2017.
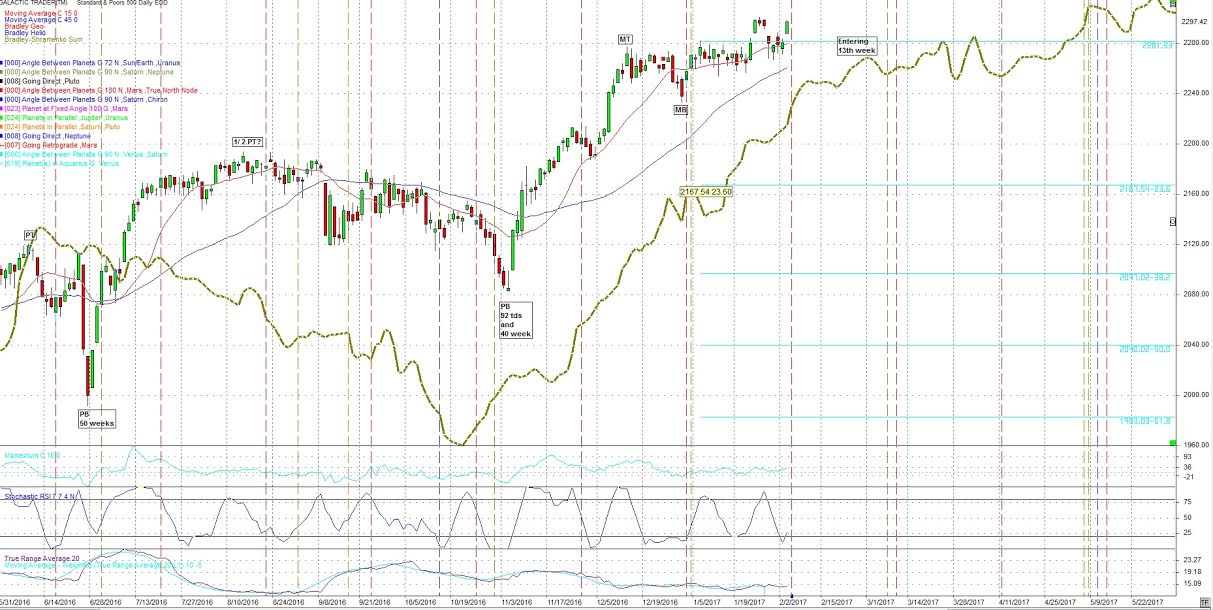
Following is a daily chart of the SP500. The brown line is an adjusted Bradley indicator. It's purpose is to find a change in trend. This is not straight forward to read and the details with video are in section 9 of the subscribers report. What appears to be the next Bradley turn is Feb 9 /10th. Also Price is above both the 15 and 45 day sma's. and the 15 day sma is above the 45 day. This would be a good time frame for the start of a slide down.
The January 2017 subscribers report will outline some longer term Astrological aspects and events.
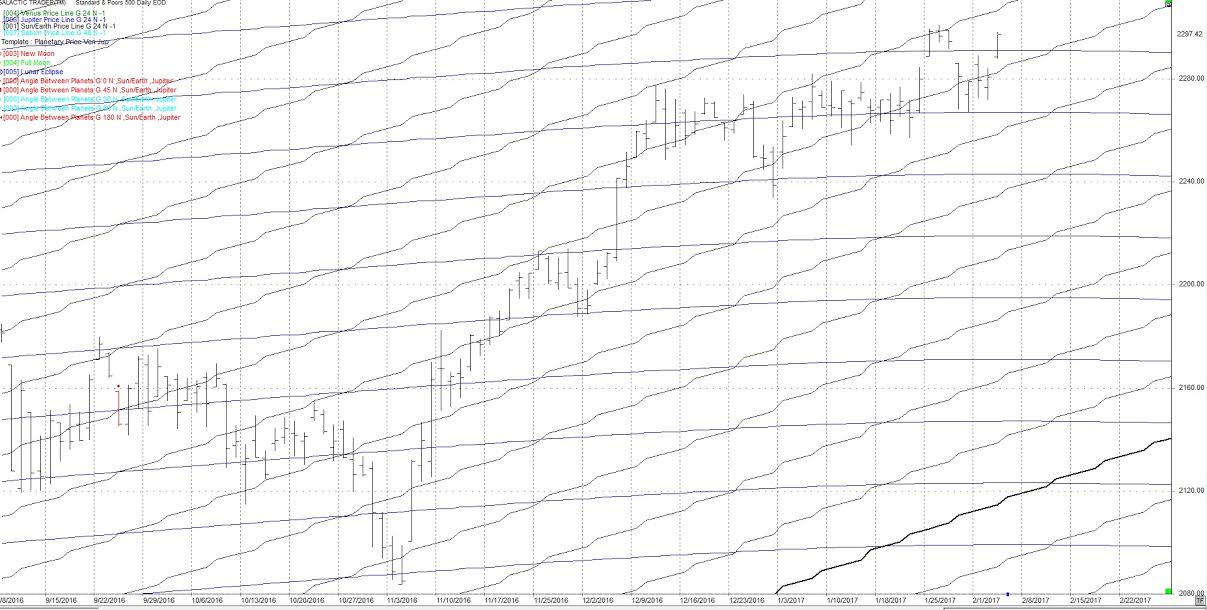
As far as aspects go, the Sun and Jupiter have an affinity for the SP500. The following daily chart of the SP500 shows the Jupiter (blue) price line and the Sun (black) price line. The price line is the longitude of the planets converted to price. On the following chart note the price tends to either reverse or make a sharp move where the Sun price line and Jupiter price line cross. The next date these lines cross is February 10th. Also note the last bar Moved up sharply which often happens just before a move down near the Jupiter retrograde.
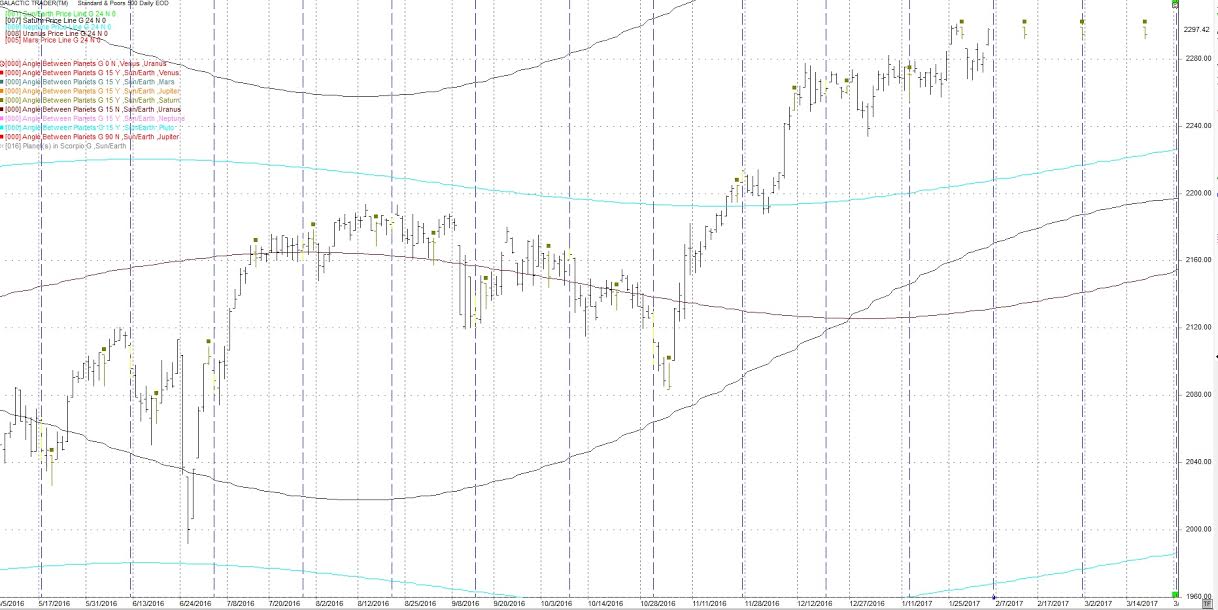
Harmonics
I continue to watch the 24th harmonic cycle (360 / 24) cycles. The brown squares are Sun / Saturn 15 degrees on the following daily chart.
The next hits are Feb 14, 2017 then March 1, 2017.
I have added 3 price lines to this chart.
Saturn - black
Uranus - purple
Neptune - light blue
These price lines can act as Support/Resistance . Also on this chart are blue vertical line which is the 24 cd (calendar day) cycle. It has been at highs and lows. The next date is February 6th.
Looking forward I'm expecting very volatile markets in February followed by difficult markets in the late February / April timeframe.
There have been a number of earthquakes over 6.5 the last couple of weeks. I'm expecting more. Watch the periods around Feb 10th and Feb 26 for more significant geophysical events.
Author

TradingDaze
Aisys Technologies Inc.
Gordon Lawson, aka TradingDaze, is a Canadian CPA, certified computer programmer and Astrologer. My traditional career spanned 25 years as a Financial Analyst at Suncor and Manager of Information Systems at BP Resources Canada. After this time Mr.


