S&P 500: Have we seen a near-term bottom?
The number of superlatives you can use to describe the stock market's recent drop is truly incredible:
- The S&P 500's relative strength indicator (RSI) had previous hit its highest level ever on the weekly chart (near 90).
- It was the first time ever that the Dow fell 10% from all-time highs in just nine days.
- The S&P 500's daily RSI experienced its largest two-week decline on record (-58 points) during the drop.
- et cetera, et cetera, et cetera...
...and despite all that, the S&P 500 is currently trading down by just about 1% on the year after Monday's bounce!
So could we have seen the bottom already?
Despite many quantitative traders' preferences to the contrary, investing will always be more an art than a science. The truth is that there are no iron-clad "laws" of investing and well always being trying to empirically derive "rules of thumb" from ludicrously small, heterogeneous sample sizes. That said, there are certain combinations of indicators that we believe can help identify near-term extremes in market sentiment.
One set of indicators we monitor, shamelessly borrowed from Cam Hui, is called the "Trifecta Model" for spotting near-term bottoms. In essence, it looks for extreme readings across three uncorrelated oversold indicators:
1) The VIX term structure, which measures the implied volatility of front month at-the-money options relative to that of similar options with three months until expiration. In essence, readings about 1.00 on this indicator show excessive short-term fear in the options markets.
2) The TRIN, which compares the number of advancing and declining to stocks to the volume in those stocks. A reading above 2 signals strong selling volume, or excessive fear in the stock market
3) The number of S&P 500 stocks trading above their 50-day MAs relative to the number trading above their 150-day MAs, where a move below 0.5 represents an excessively fast drop in the market relative to the medium-term trend.
The chart below plots the S&P 500 with vertical lines in weeks where all three of the above indicators crossed the above thresholds:
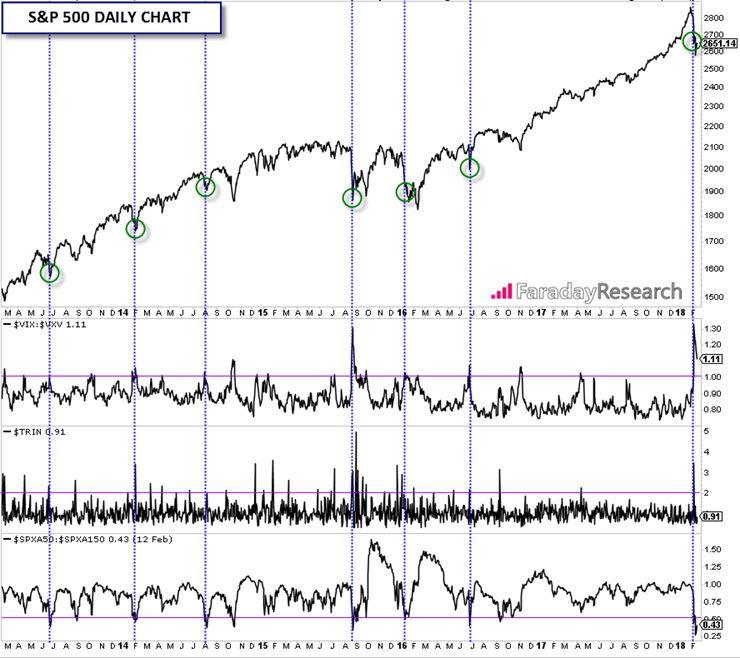
Source: Stockcharts.com, Faraday Research
As you can see, this combination of indicators has done a fairly good job of highlighting short-term oversold extremes over the last five years. Like any model, it's track record isn't perfect though; for instance, it highlighted a possible panic bottom in August 2015, and while the S&P 500 did rally somewhat from those lows over the next two months, it failed to reach a new high and eventually broke back below those lows again in early 2016 (triggering another slightly-premature signal in the process).
That said, last week's signal easily eclipsed all three indicator thresholds, quantifying the amount of panic in the market as the highest in the last five years (with the possible exception of the US debt downgrade in 2015). Over the course of the big nearly-decade long uptrend, similar signals have proven to be near-term buying opportunities more often than not.
Author

Matt Weller, CFA, CMT
Faraday Research
Matthew is a former Senior Market Analyst at Forex.com whose research is regularly quoted in The Wall Street Journal, Bloomberg and Reuters. Based in the US, Matthew provides live trading recommendations during US market hours, c


