S&P 500 Elliott Wave Technical Analysis
MAIN ELLIOTT WAVE COUNT
WEEKLY CHART
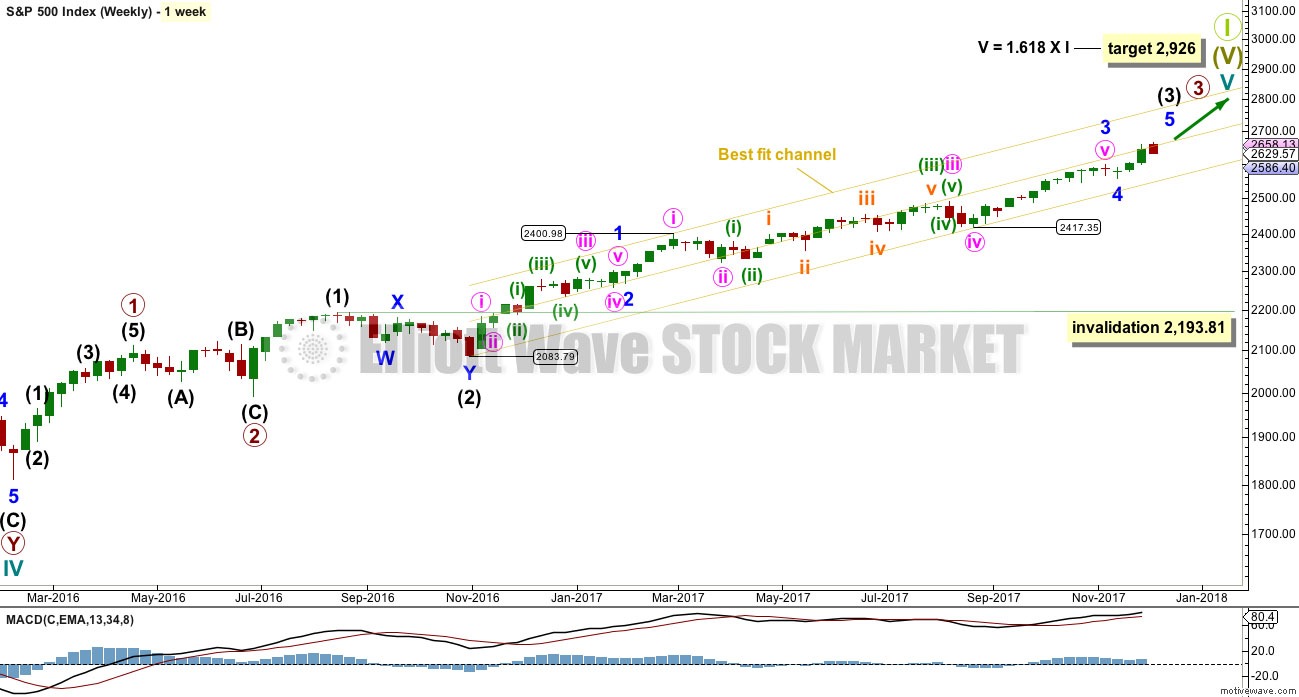
Cycle wave V must complete as a five structure, which should look clear at the weekly chart level. It may only be an impulse or ending diagonal. At this stage, it is clear it is an impulse.
Within cycle wave V, the corrections for primary wave 2 and intermediate wave (2) both show up clearly, both lasting several weeks. The respective corrections for intermediate wave (4) and primary wave 4 should also last several weeks, so that they show up at weekly and monthly time frames. The right proportions between second and fourth wave corrections give a wave count the right look. This wave count expects to see two large multi week corrections coming up, and the first for intermediate wave (4) may now be quite close by.
Cycle wave V has passed equality in length with cycle wave I, which would be the most common Fibonacci ratio for it to have exhibited. The next most common Fibonacci ratio would be 1.618 the length of cycle wave I.
Intermediate wave (3) may now be nearing completion (the alternate hourly wave count looks at the possibility it could be complete at yesterday's high). When it is complete, then intermediate wave (4) should unfold and be proportional to intermediate wave (2). Intermediate wave (4) may be very likely to break out of the yellow best fit channel that contains intermediate wave (3). Intermediate wave (4) may not move into intermediate wave (1) price territory below 2,193.81.
The yellow best fit channel is redrawn. Price points are given so that members may replicate this channel. This channel is copied over to the daily chart.
DAILY CHART
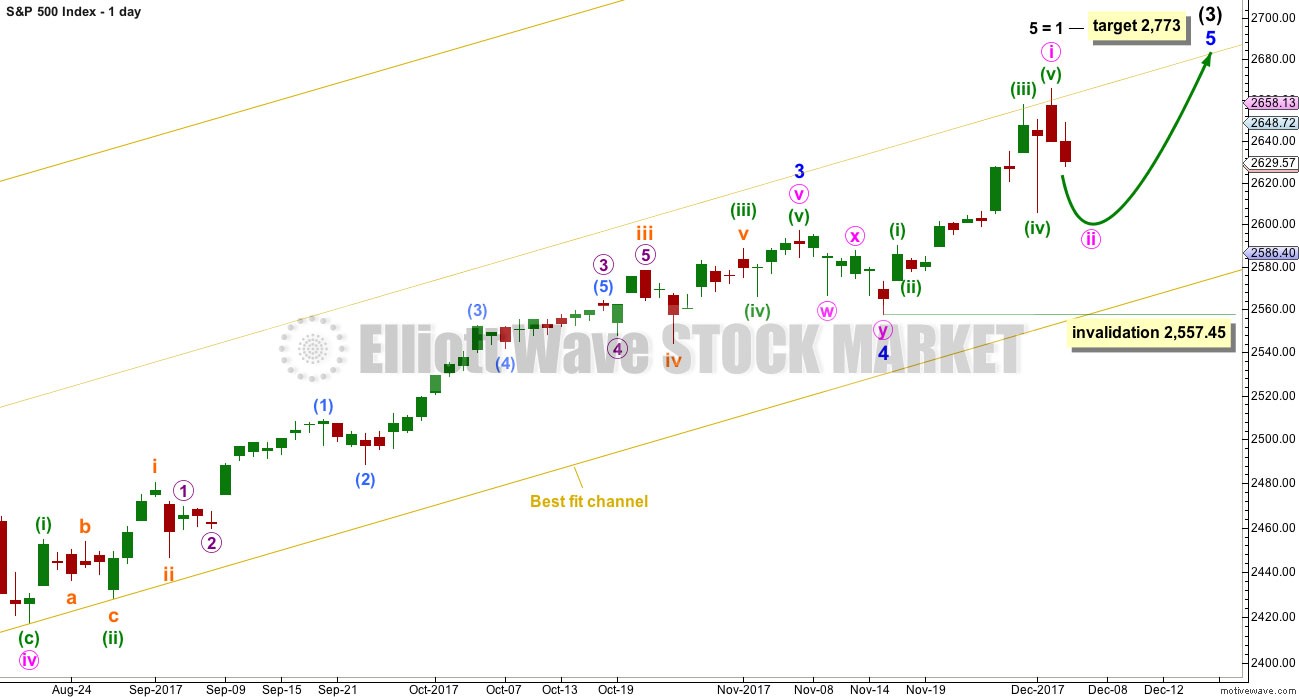
We should always assume the trend remains the same until proven otherwise. Assume that minor wave 5 is incomplete while price remains above 2,557.45.
The target calculated for minor wave 5 expects it to exhibit the most common Fibonacci ratio for a fifth wave. This target would not expect a Fibonacci ratio for intermediate wave (3) to intermediate wave (1).
Within minor wave 5, no second wave correction may move beyond the start of its first wave below 2,557.45.
HOURLY CHART
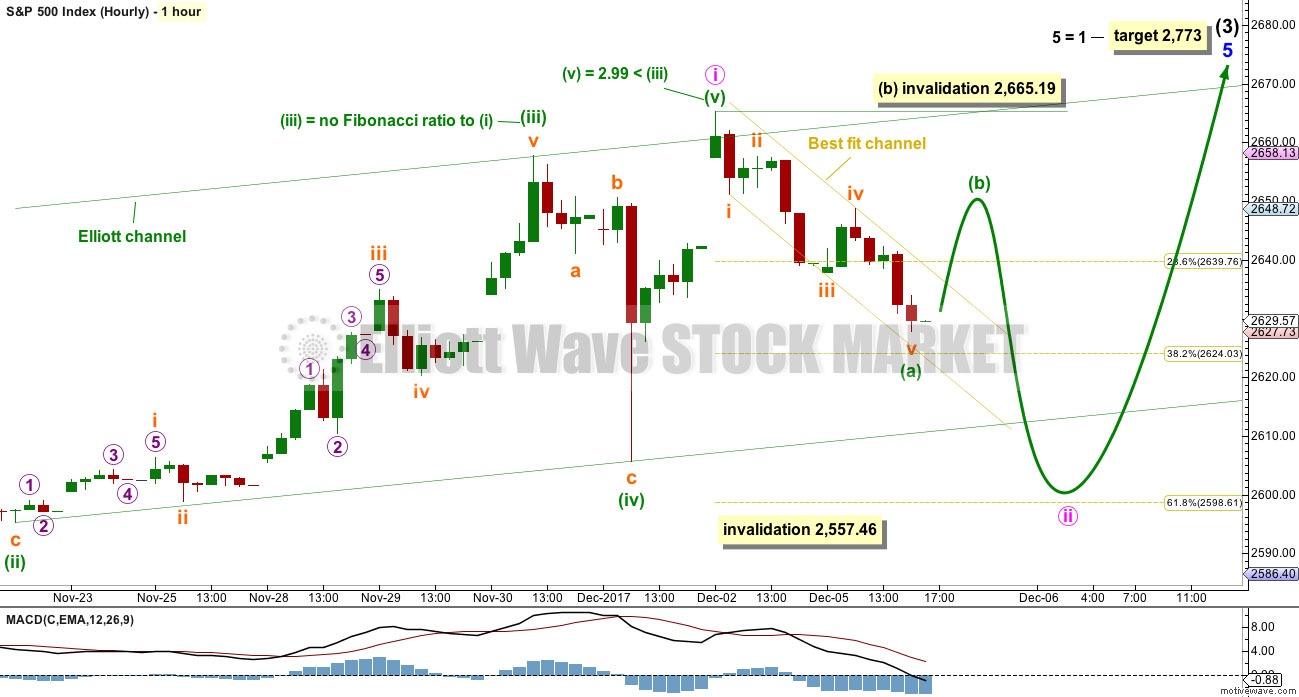
This first hourly chart follows on from labelling on the daily chart.
A five up from the low of minor wave 4 is complete. This wave count fits with MACD: the strongest momentum within this five up is the end of the third wave of minuette wave (iii), and within the third wave the strongest portion of the histogram is its middle, subminuette wave iii. At the end of the five up, there is some divergence with price and momentum for the fifth wave of minuette wave (v).
With a five up now compete, a three down should follow. If minor wave 5 is incomplete, then only minute wave i may be over at today's high. Now minute wave ii may take a few days to complete. The most likely point for it to end may be the 0.618 Fibonacci ratio about 2,599, but the 0.382 Fibonacci ratio about 2,624 is also a reasonable target.
There is a five down complete at the hourly chart level. If my analysis of this wave down is correct, then it should be followed by a small bounce for minuette wave (b). Before this happens though, it is entirely possible that minuette wave (a) may continue lower. Use the yellow best fit channel as a guide as to when minuette wave (a) is complete and minuette wave (b) has arrived. When price breaks above the upper edge of this channel, then assume that minuette wave (b) has begun.
Minuette wave (b) may not move beyond the start of minuette wave (a) above 2,665.19.
Minute wave ii looks like it may now end closer to the 0.618 Fibonacci ratio than the 0.382 Fibonacci ratio. It may be subdividing as a simple zigzag.
ALTERNATE HOURLY CHART

Because we should always assume the trend remains the same until proven otherwise, this wave count should be considered an alternate while price has not confirmed it.
By simply moving the degree of labelling within the five up from the end of minor wave 4 all up one degree, it is possible to see that intermediate wave (3) could be over.
If this wave count is confirmed with a new low below 2,557.46, then it would expect a multi week pullback or consolidation for intermediate wave (4) to last about ten weeks or so.If it is a complicated combination or a triangle, then it may be longer lasting, possibly a Fibonacci thirteen or even twenty-one weeks.
At this early stage, the 0.382 Fibonacci ratio of intermediate wave (3) would be a reasonable target.
For the short term (the next week or so), a trend change at intermediate degree should see a larger five down develop at the hourly chart level. So far only a first wave within that five down may be complete.
Minute wave ii may not move beyond the start of minute wave i above 2,665.19.
Both wave counts expect overall the same direction next.
TECHNICAL ANALYSIS
WEEKLY CHART
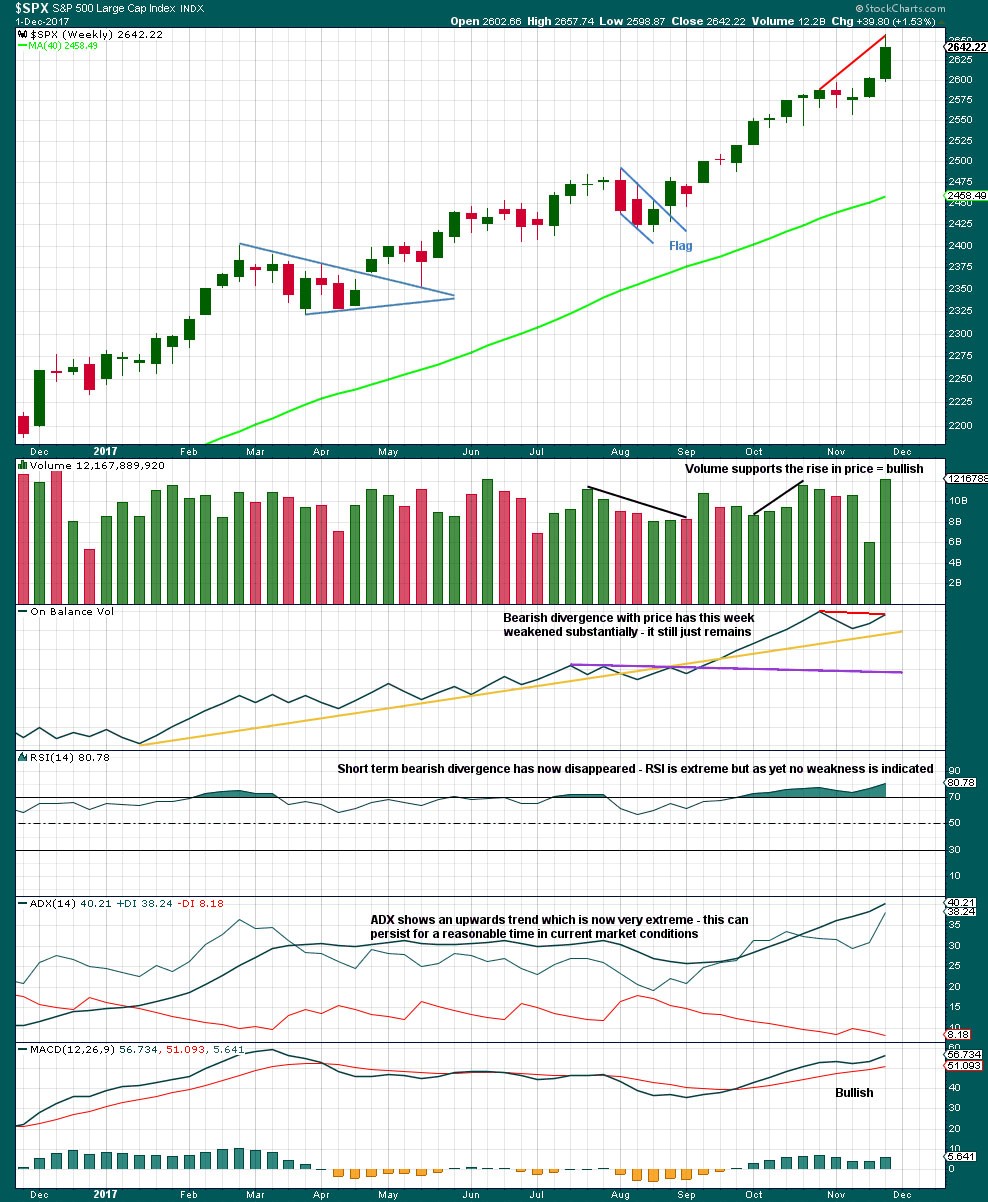
This last week completed the strongest volume for a year, which for an upwards week is very bullish.
The problem with divergence, and one reason why it is hopeless as a timing tool, is that sometimes it just disappears. That is what has happened between divergence with price and RSI. Still, the failure of On Balance Volume to make new all time highs with price is bearish especially if On Balance Volume is a leading indicator.
This trend is extreme, but it could still continue for a while longer. Look for a candlestick reversal pattern or a bearish signal from On Balance Volume.
DAILY CHART
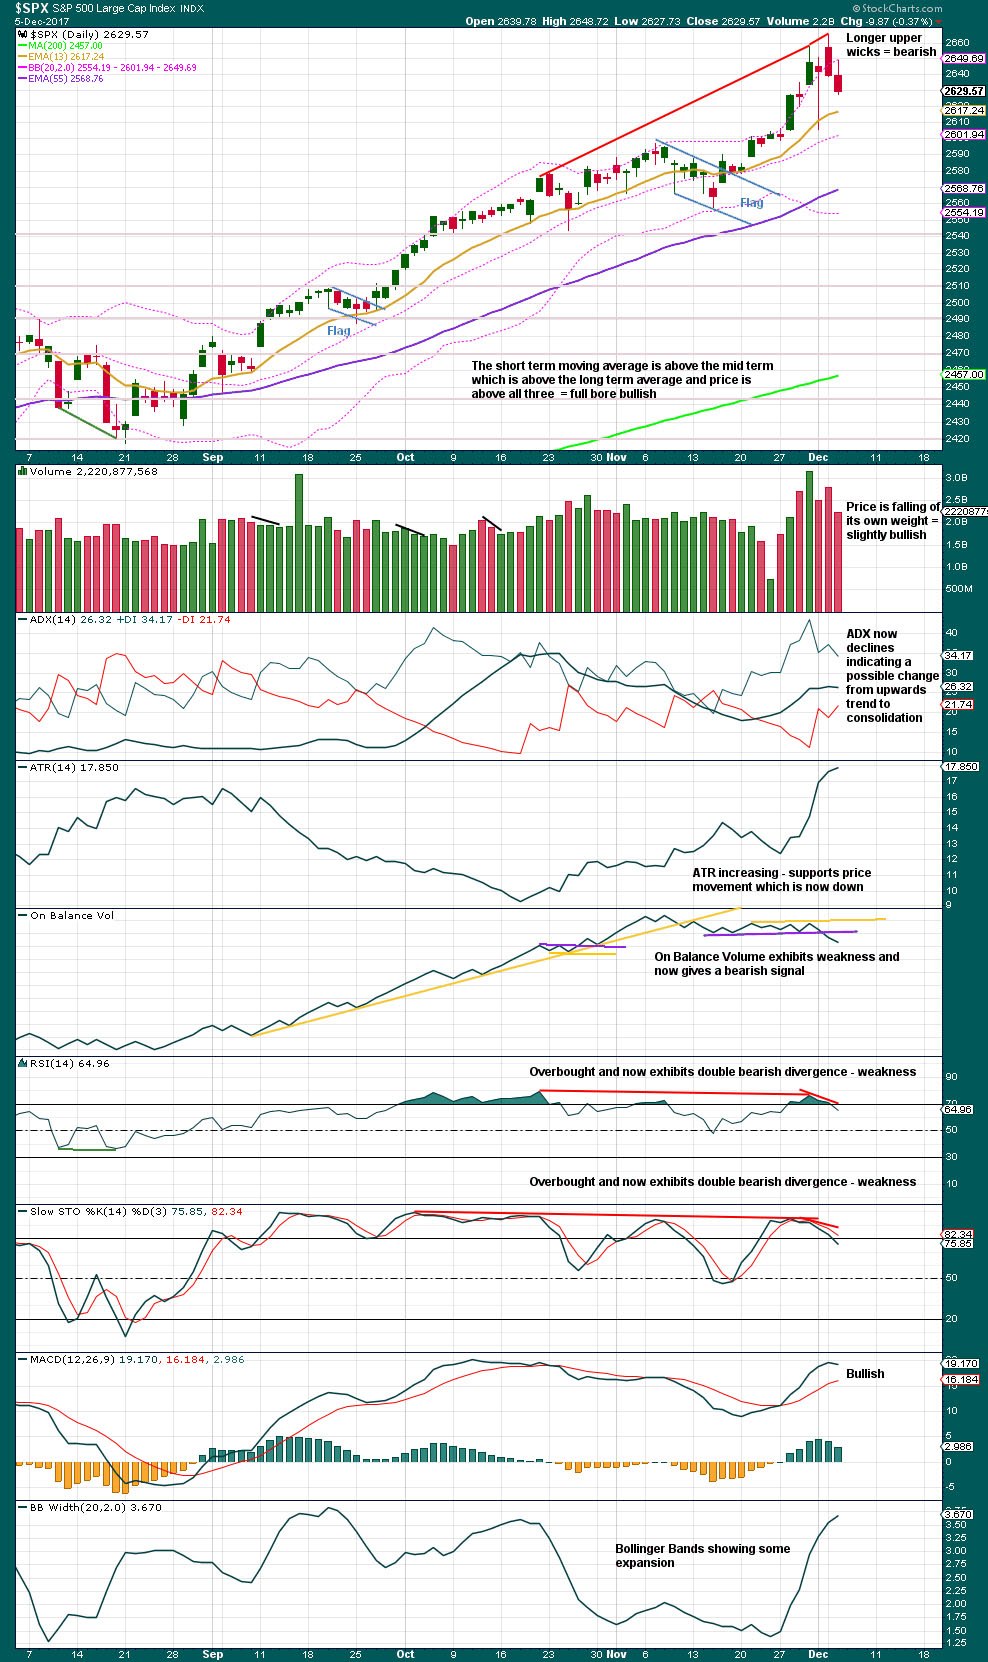
The target using the measured rule from the last flag pattern was about 2,633. It was met and well passed. Price is now turning downwards.
RSI, Stochastics and On Balance Volume are all bearish.
This analysis gives weight to the bearish signal from On Balance Volume. This is exactly the kind of signal which turns up at trend changes of reasonable magnitude. Today, it is looking a little more like a trend change of a reasonable magnitude, and this supports the alternate hourly Elliott wave count.
VOLATILITY – INVERTED VIX CHART
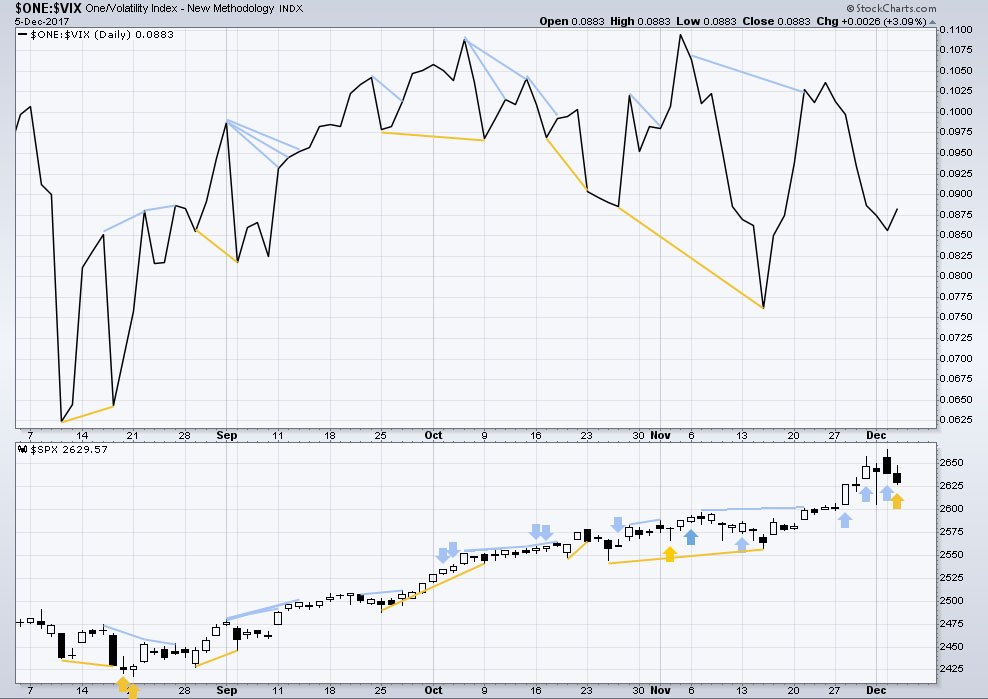
So that colour blind members are included, bearish signals will be noted with blue and bullish signals with yellow.
Normally, volatility should decline as price moves higher and increase as price moves lower. This means that normally inverted VIX should move in the same direction as price.
Another bearish signal noted yesterday between price and inverted VIX has now been followed by a downwards day. This bearishness may now be resolved, or it may require another downwards day to resolve it.
Price has moved lower today, but inverted VIX has moved higher. Downwards movement did not come with a normal increase in volatility. Volatility declined, which indicates weakness within price today and is interpreted as bullish.
BREADTH – AD LINE
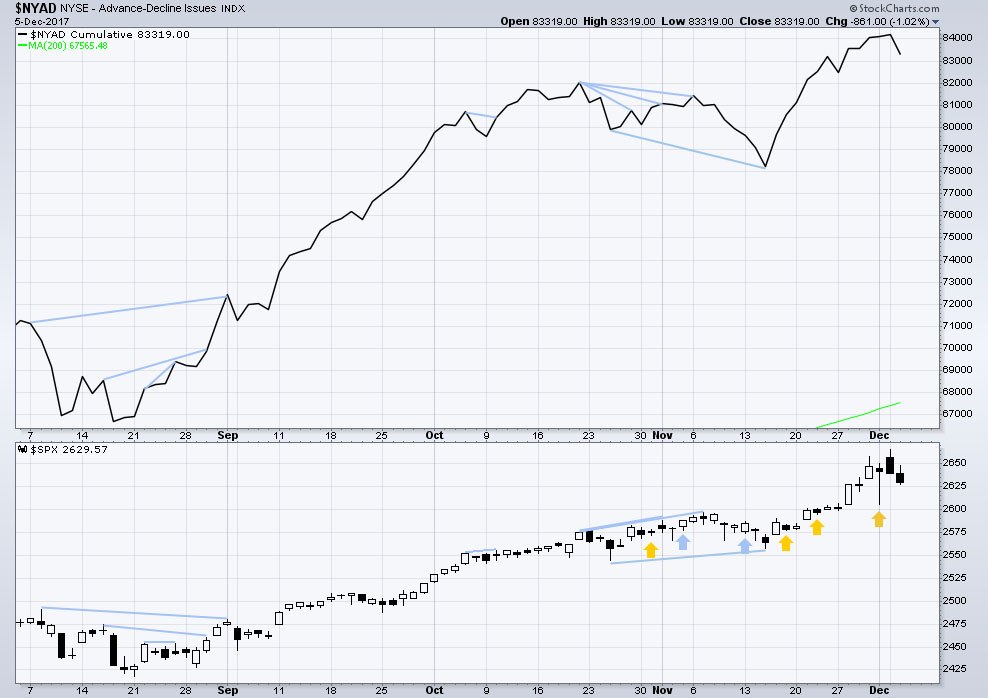
There is normally 4-6 months divergence between price and market breadth prior to a full fledged bear market. This has been so for all major bear markets within the last 90 odd years. With no longer term divergence yet at this point, any decline in price should be expected to be a pullback within an ongoing bull market and not necessarily the start of a bear market.
All of large, mid and small caps last week have made new all time highs. The rise in price has support from market breadth.
The fall in price today comes with a corresponding normal decline in market breadth. The fall in price is supported by a fall in breadth, which is bearish.
DOW THEORY
The DJIA, DJT, S&P500 and Nasdaq have last week made new all time highs. This provides confirmation of the ongoing bull market.
The following lows need to be exceeded for Dow Theory to confirm the end of the bull market and a change to a bear market:
DJIA: 17,883.56.
DJT: 7,029.41.
S&P500: 2,083.79.
Nasdaq: 5,034.41.
Author

Lara Iriarte, CMT
Elliott Wave Gold
Lara Iriarte is a Chartered Market Technician and a Registered Financial Advisor in New Zealand.


