Since the Silver market soared, has a top already formed?

Silver outperformed gold in quite an impressive way. However, can this really be considered bullish, or was it in fact just a correction?
Yesterday’s session was nothing particularly new except for silver’s performance, which is what I will focus on in my analysis of it today.
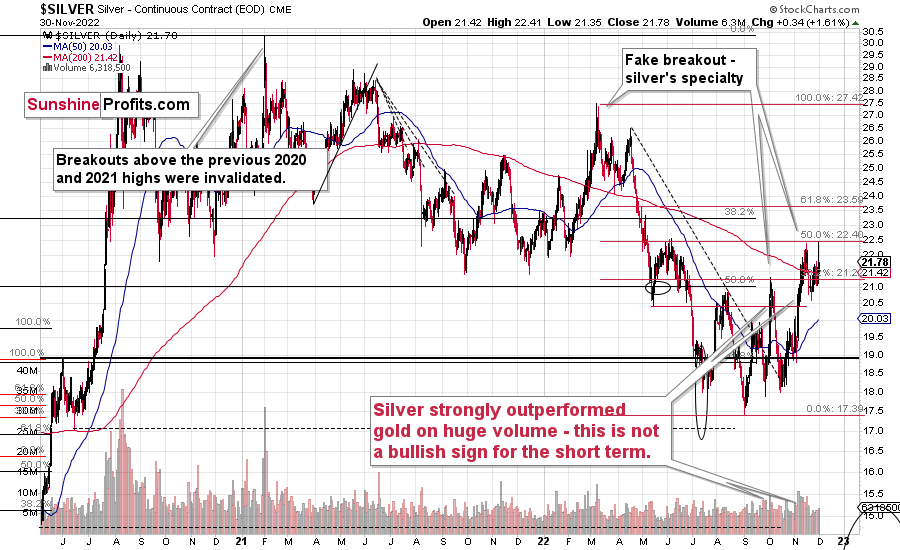
The silver market truly soared on an intraday basis, especially relative to gold. This is what we most often see at the tops or very close to them.
The buying frenzy
The reason is that the silver market is much smaller than the gold market is, and in addition to the above (and in relation to it), silver is much more popular with the investment public. The latter tends to buy close to the tops and sell close to the bottoms. Consequently, the particularly strong performance of the white metal indicates that the investment public is “buying like crazy,” and this, in turn, is a sign that a top is being formed. That’s what we saw yesterday.
Interestingly, silver’s rally yesterday was accompanied by yet another daily rally in the main stock indices. The S&P 500 moved above 4,000 once again, especially initially, and it was during this sharp rally that silver rallied the most. This tells us that perhaps similar buyers (the investment public) were buying stocks, and it serves as a small indication that stocks might have topped as well (or that they top in stocks could be just around the corner).
Technically, it was yet another move to the 50% Fibonacci retracement, so it didn’t change anything. The only new indication was gold’s outperformance, and it has bearish implications.
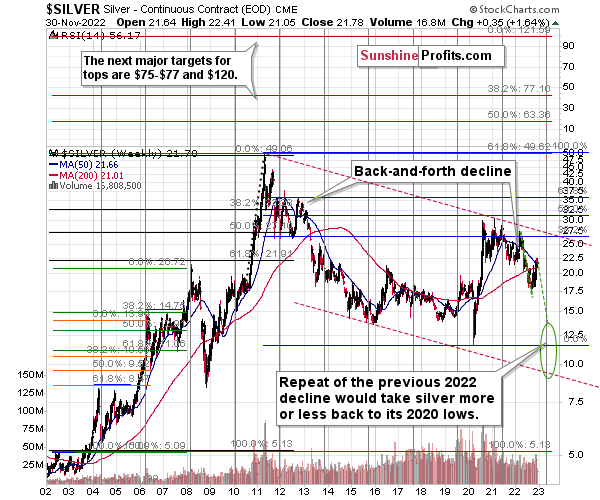
When looking at silver from a long-term point of view, it’s still obvious that the recent move higher was most likely just a corrective upswing.
Will There Be a 2022 Repeat?
What happens after corrections are over (as indicated by, i.e., silver’s outperformance)? The previous trend resumes. The previous trend was down, so that’s where silver is likely headed next.
Besides, the long-term turning point for silver is due in several months, and if silver repeats its previous 2022 decline, then it will bottom close to the turning point and also close to its 2020 low – in the first half of 2023.
It’s likely to repeat its previous 2022, because that’s what tends to happen after flag patterns, and what you see on silver’s short-term chart between September and yesterday appears to be a flag pattern.
Consequently, the current silver price forecast remains bearish, as does the outlook for the rest of the precious metals sector.
Want free follow-ups to the above article and details not available to 99%+ investors? Sign up to our free newsletter today!
Want free follow-ups to the above article and details not available to 99%+ investors? Sign up to our free newsletter today!
Author

Przemyslaw Radomski, CFA
Sunshine Profits
Przemyslaw Radomski, CFA (PR) is a precious metals investor and analyst who takes advantage of the emotionality on the markets, and invites you to do the same. His company, Sunshine Profits, publishes analytical software that any


