Silver is underpriced given supply and demand dynamics

Global industrial demand for silver in 2023 is expected to set a record leading to another big market deficit, according to preliminary projections by the Silver Institute.
And silver isn't currently priced for this dynamic.
The Silver Institute released preliminary supply and demand numbers at its Silver Industry Dinner in New York City in November.
Industrial silver demand is projected to rise by 8 percent to a record 632 million ounces.
According to the Silver Institute, investment in photovoltaics, power grid and 5G networks, growth in consumer electronics, and rising vehicle production all helped drive industrial demand higher.
Industrial silver demand will be offset by lower physical investment demand. Silver coin and silver bar demand is projected to drop by 21 percent to 263 million ounces after setting a record in 2022. This is primarily due to a big drop in silver investment in India and Germany. Record-high local silver prices in India drove profit-taking throughout most of the year. In Germany, a Value Added Tax hike on some silver coins at the start of 2023 dampened investor enthusiasm.
Even with the year-on-year decline overall in investment demand, it remained at a historically high level globally. Strong investment sentiment in North America helped offset the decline in India and Germany.
Investment in paper silver also dropped in 2023. The Silver Institute projects record outflows for Exchange Traded Funds (ETFs) for the second straight year due to monetary tightening and a boost in yields. Outflows are expected to drop by 40 million ounces, about one-third of 2022’s record outflows.
Excluding India, global jewelry demand is expected to rise slightly in 2023. India will see a decline in jewelry demand after a record surge in 2022.
Silverware is expected to decline by as much as 12 percent globally.
Overall, silver demand will drop by about 10 percent to 1.14 billion ounces. However, according to the Silver Institute, total demand remains historically elevated and will come in at the second-highest level in history.
On the supply side, global mined silver is anticipated to fall by 2 percent year-on-year to 820 million ounces, driven by lower output from operations in Mexico and Peru.
Falling silver production in Mexico seems to be developing as a trend. The country has historically ranked as the world's top silver producer, but Mexican mine output has dropped 25 percent in the last two years.
With a combination of historically high demand and falling mine output, the Silver Institute projects a 140 million-ounce market deficit in 2023.
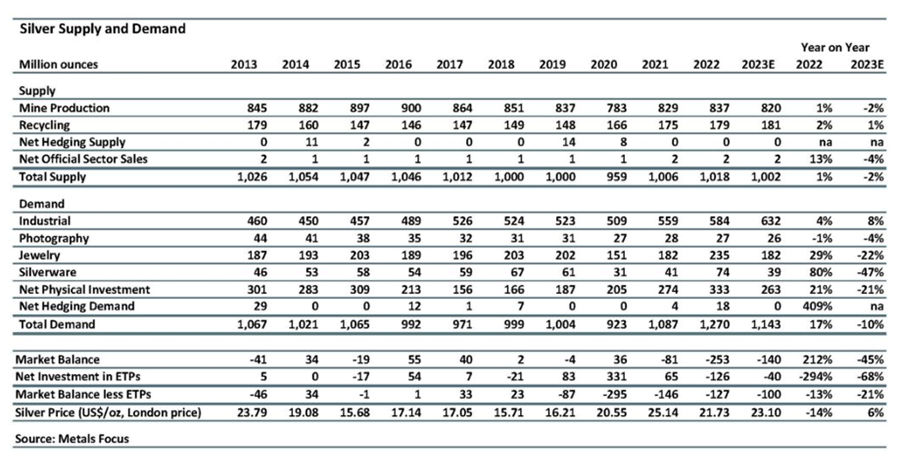
Given the current macroeconomic environment, and the supply and demand dynamics, silver appears to be significantly undervalued at $23 to $25 an ounce.
According to the Silver Institute's projections, 2023 will chart the third consecutive annual deficit in a row.
The Silver Institute called the 2022 deficit “possibly the most significant deficit on record.” It also noted that “the combined shortfalls of the previous two years comfortably offset the cumulative surpluses of the last 11 years.”
Meanwhile, the demand for solar power is rising rapidly and it is projected to drive the industrial demand for silver significantly higher.
The International Energy Association (IEA) predicts that in 2023, investment in the solar power industry will exceed the amount of money flowing into oil production.
Due to its outstanding electrical conductivity, silver is an important element in the production of solar panels. It is used to conduct electrical charges out of the solar cell and into the system. Each solar panel only uses a small amount of silver, but with the demand for solar panels growing exponentially every year, those small amounts of silver add up.
According to a research paper by scientists at the University of New South Wales, solar manufacturers will likely require over 20 percent of the current annual silver supply by 2027. By 2050, solar panel production will use approximately 85–98 percent of the current global silver reserves.
Recession worries would typically dampen industrial demand for silver, but the photovoltaic industry is essentially recession-proof due to support from governments around the world. With battling climate change a priority, it is highly unlikely investment in solar power and other green energy technologies will fall, even during an economic downturn.
All of this signals a rapid increase in silver demand in an environment of constrained supply.
And while industrial offtake accounts for roughly half of global silver demand, at its core, silver is a monetary metal. It tends to track with gold over time. In fact, silver often outperforms gold during a gold bull run.
In other words, if you're bullish on gold due to the prospect of loosening Federal Reserve monetary policy and a resurgence of inflation, you should be bullish on silver as well.
Since the world went to a total fiat money system, there seems to be some correlation between the silver-gold ratio and central bank money creation. During periods of central bank money-printing, the gap tends to shrink. For instance, it plummeted in the aftermath of the 2008 financial crisis as the Fed engaged in extreme monetary policy.
Silver isn’t currently priced for this dynamic.
In fact, silver is significantly undervalued compared to gold.
The current silver-gold ratio is just over 87-1. That means it takes over 87 ounces of silver to buy an ounce of gold. To put that into perspective, the average in the modern era has been between 40:1 and 50:1. Historically, the ratio has always returned to that mean. And when it does, it does it with a vengeance. The ratio fell to 30-1 in 2011 and below 20-1 in 1979.
Given the current silver price, the silver-gold ratio, and the supply and demand dynamics, silver appears to be on sale.
To receive free commentary and analysis on the gold and silver markets, click here to be added to the Money Metals news service.
Author

Mike Maharrey
Money Metals Exchange
Mike Maharrey is a journalist and market analyst for MoneyMetals.com with over a decade of experience in precious metals. He holds a BS in accounting from the University of Kentucky and a BA in journalism from the University of South Florida.


