Oil outlook: Bullish outlook maintained

The price action of WTI continued to move in an upward manner despite some hesitation early past week. In the current report we intend to have a look at the state of the US oil market, yet also on an international level, discuss factors on the demand and supply sides that drive oil prices. To conclude the report we will also provide a technical analysis of WTI’s daily chart.
Mixed signals from US Oil market
We make a start of our review of the US oil market by noting that the number of active oil rigs in the US fell by three according to Baker Hughes. The release tended to imply an easing of demand which could weigh on oil prices. Yet on Tuesday API reported a -2.286 million barrels drawdown of US oil inventories, implying some tightness in the US oil market. On the other hand, EIA reported an increase of US oil inventories of 3.210 million barrels, implying that aggregated demand was not able to catch up with production levels. The release contradicted API’s and implied a continuance of the slack reported past week in the US oil market. Overall should the data align towards showing a tightening of the US oil market, we may see oil prices getting some support.
Increase of Oil demand ahead?
On the demand side of the international oil market, we note the expansion of economic activity for the manufacturing sectors of the US and China. It was characteristic how the ISM manufacturing PMI figure for March surpassed the reading of 50, for the first time since October 2022 thus implying that growth has returned for the US manufacturing sector in the past month. The increase of economic activity in the US manufacturing sector was also confirmed by a beyond-market-expectations acceleration of the US factory orders for February. Similarly, we also had an improved reading for China’s NBS manufacturing PMI indicator, also for March, showing an expansion of economic activity for the huge Chinese manufacturing sector. The increase of economic activity for the manufacturing sector could inherently lead to an increase of oil demand at an international level which in turn could drive oil prices higher.
OPEC to maintain low production levels
On the production side of the international oil market, we note that OPEC+’s joint ministerial meeting practically resulted in the oil-producing organisation maintaining its low production levels. It should be noted that Iran and Kazakhstan also pledged to achieve full conformity as to compensate for overproduction, while Russia will be basing its production cuts not on exports but on production as such, according to Reuters. In its statement following the meeting, OPEC+ mentioned that "Participating countries with outstanding overproduced volumes for the months of January, February and March 2024 will submit their detailed compensation plans to the OPEC Secretariat by 30 April 2024,". All of the above if combined with the possibility of increased demand could lead to a substantial tightness of the international oil market that may push oil prices higher in the coming months.
Tensions in the Middle East intensify Oil market worries
Tensions in the Middle East escalated in the past week, as Iran blamed Israel for an airstrike of its embassy in Damascus Syria, killing seven persons among which also Mohammed Reza Zahedi, a top commander in Iran’s Revolutionary Guards. Iran vowed to retaliate hence we expect tensions to rise even further in the area. Please note that the above developments happened as the war on Gaza is ongoing with tens of thousands of civilian casualties among Palestinians. Moreover, Israel seems to be preparing for the possibility of a full-blown-out war in Lebanon with Hezbollah. The developments understandably intensify market worries for the supply side of the international oil market and may be an additional factor that could drive oil prices higher.
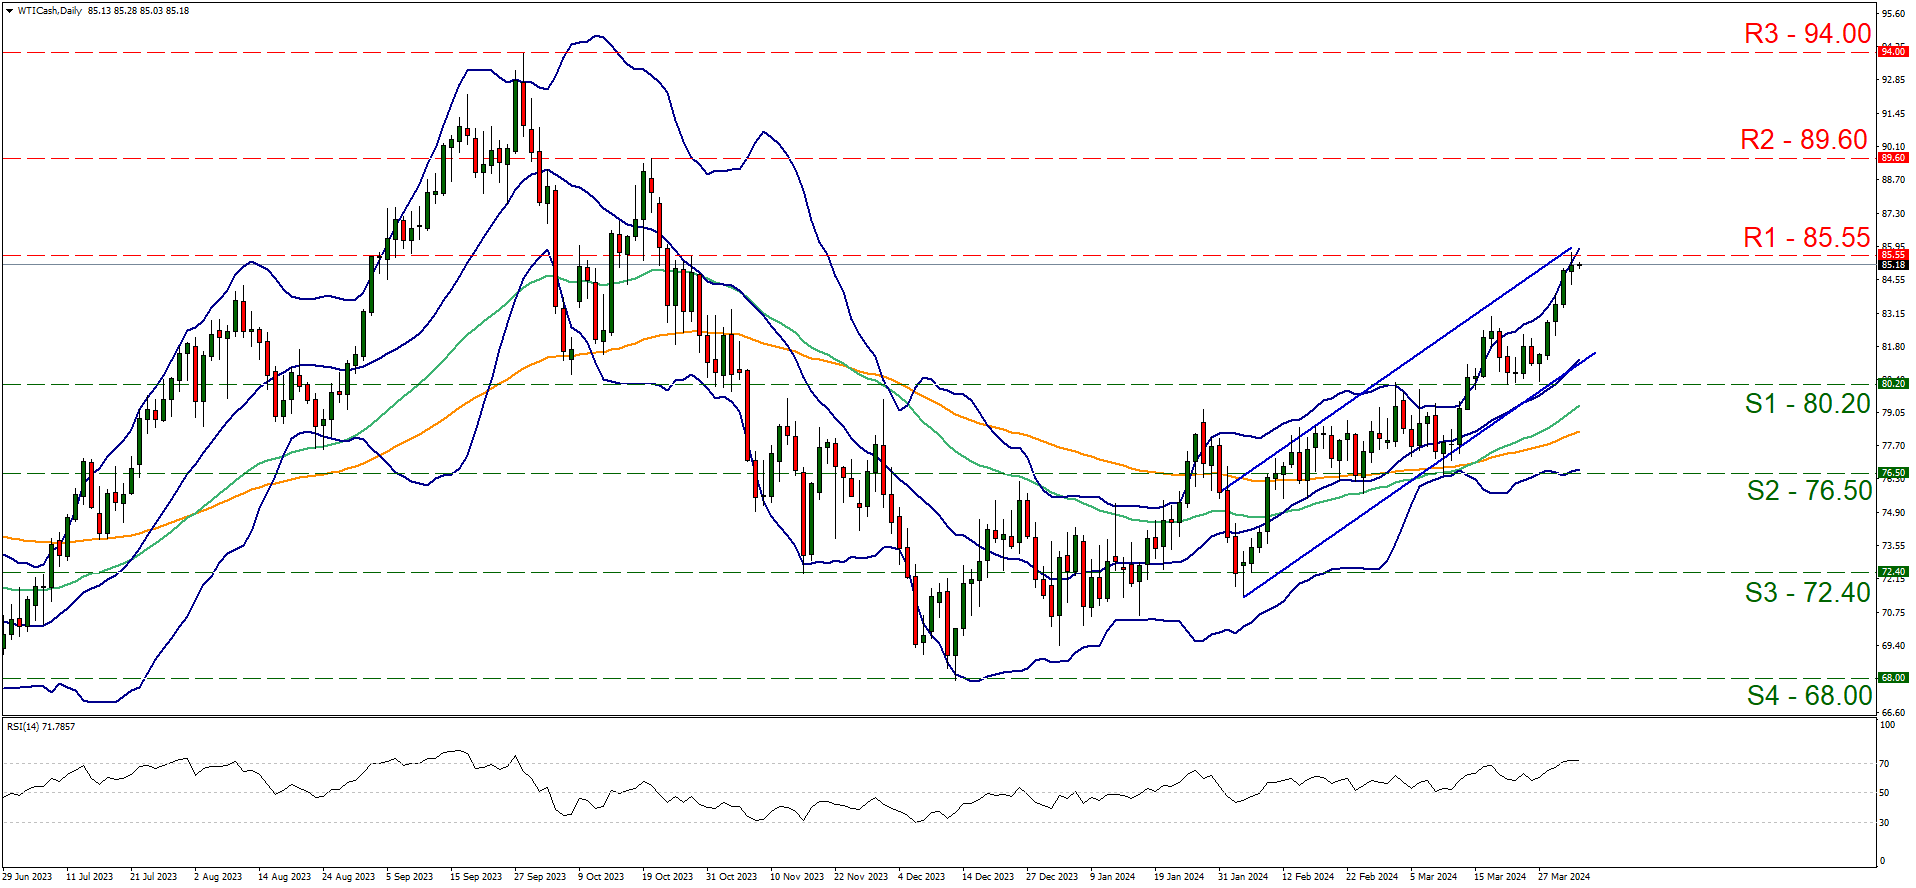
Technical analysis
WTI daily chart
-
Support: 80.20 (S1), 76.50 (S2), 72.40 (S3).
-
Resistance: 85.55 (R1), 89.60 (R2), 94.00 (R3).
Oil bulls continued to lead WTI’s price and the commodity’s price action has now reached the 85.55 (R1) resistance line, a level not seen since late October last year. We still see WTI’s price moving within the boundaries set by the upward channel identified by last week’s report and has directed WTI’s price since the 5th of February. Hence we tend to maintain our bullish outlook for the commodity’s price on a technical level and we note that the 20, 50 and 100 moving averages are all pointing upwards also supporting the idea of a bullish outlook. Yet we would say also a word of caution as the RSI indicator has surpassed the reading of 70, highlighting the strong bullish sentiment in the market for WTI, yet may also be implying that the commodity’s price has reached overbought levels and may be ripe for a correction lower. Should the bulls, maintain control over WTI’s price action, we expect to see it breaking the 85.55 (R1) resistance line and take aim at the 89.60 (R2) resistance level. Should the R2 be broken we note the 94.00 (R3) resistance barrier as the next possible target for the bulls. For a bearish outlook, we would require the commodity’s price to reverse direction, to break the lower boundary of the current upward channel guiding WTI’s price action which would be a first signal that the upward movement was interrupted. The WTI’s price may continue lower and break the 80.20 (S1) support line, and actively aim for the 76.50 (S2) support base. In a more extreme bearish scenario, we may see WTI’s price action setting the 72.40 (S3) support level in its sights.
Author

Peter Iosif, ACA, MBA
IronFX
Mr. Iosif joined IronFX in 2017 as part of the sales force. His high level of competence and expertise enabled him to climb up the company ladder quickly and move to the IronFX Strategy team as a Research Analyst. Mr.


