Oil Markets Special: OPEC April Preview

Highlights:
- Upcoming OPEC meeting overshadowed by the surge in volatility in the oil market
- After an excellent run, oil was pricing in a global demand recovery that appears to be well underway but still faces risks
- In numbers: The up/down oil rollercoaster days of late March
The upcoming OPEC meeting has been overshadowed by the surge in volatility in the oil market. Still, the sharp drop in prices amid negative Covid-19 news, with infections on the rise in Europe, Brazil and India, has led to renewed concerns about demand. However, Reuters reported that several OPEC+ sources expect current production cuts to be extended into May when the group meets next week. It seems likely that Saudi Arabia will similarly extend its unilateral 1mb/d cut.
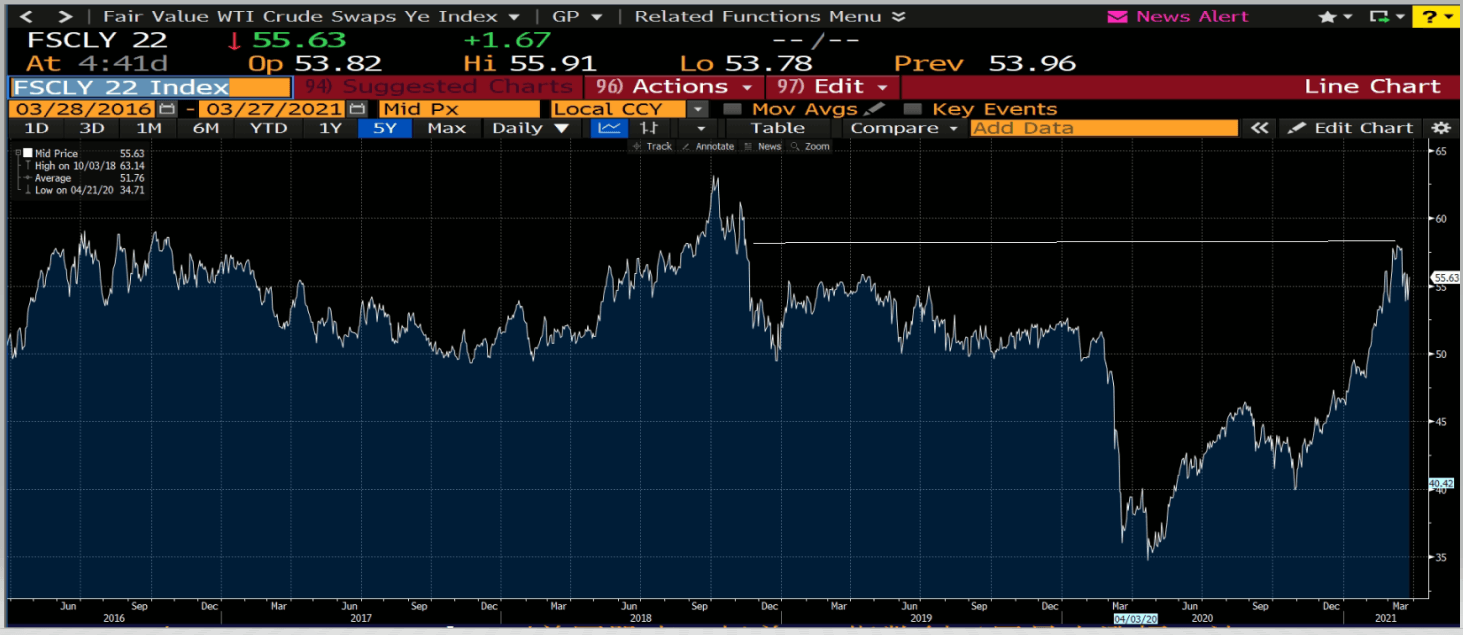
After an excellent run this year, and since the start of the fourth quarter of last year, oil was pricing in a global demand recovery that appears to be well underway but still faces risks, and sentiment will be very sensitive to any news that seems to undermine the path back to normal. And with OPEC+ extending the current quota agreement, the medium and longer-term fundamentals for oil look fine, with a deficit driven by OPEC+ cuts helping drive a global inventory draw-down. Still, the oil price will remain very sensitive to near-term news with implications for the demand outlook.
What has gone wrong with the oil markets?
Crude oil has slumped, to some extent driven by profit-taking after a year-long rally. Inflation remains a threat, and positioning is much cleaner. OPEC+ seems more likely to maintain production cuts, and the Suez Canal blockage creates supply problems. And while oil has been knocked off its lofty pedestal, it's by no means out for the count.
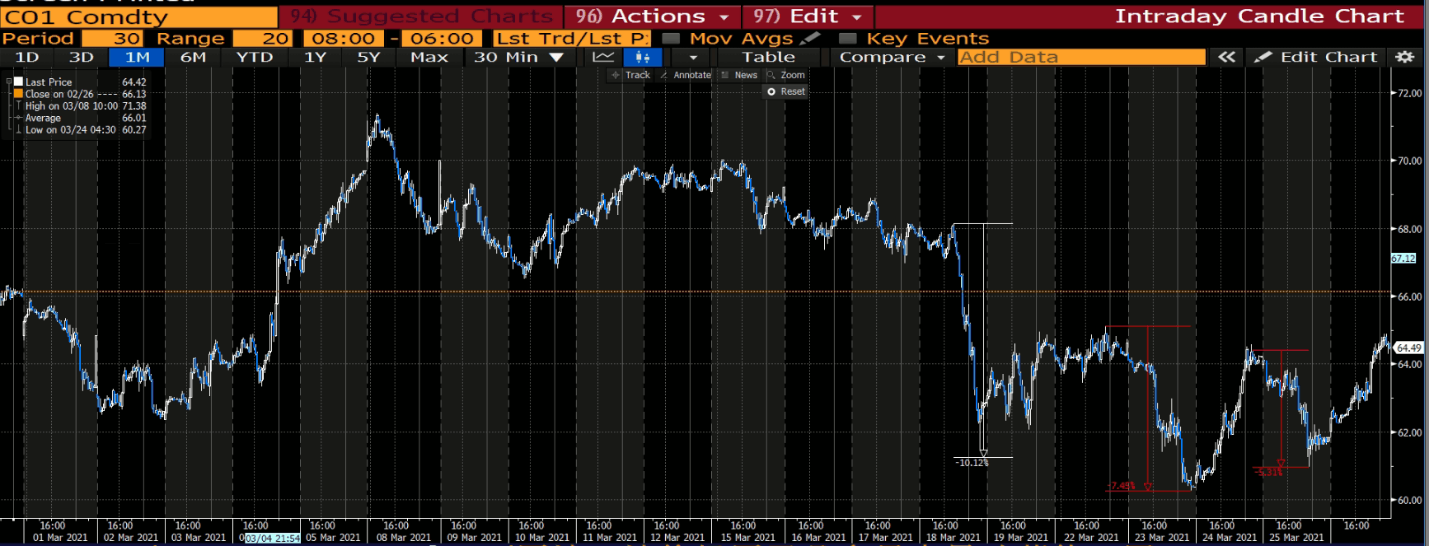
The second half of March has not been kind to oil prices, with seemingly little impetus from news flow and then a drift down from $70 was accelerated as prices dropped down through $67/bbl on February 18, triggering a cascade of profit-taking after the year-long rally.
True, the physical market showed fewer signs of tightness, but traders focused on momentum strategies changing direction.
The move was doubtlessly exaggerated as large producers hedged the highest prices for the Calander -22 strip seen since November 2018, which in turn precipitated a 10% drop in prices, and it will be interesting to see the impact in next week's CFTC report on positioning.
Strikingly, the abrupt move seems to have propelled the market into a highly volatile and frenzied state, but it’s likely a by-product of the combination of intense hedging activity, the Covid scare (which is usually a look through for oil) and a vessel the length of the Eiffel Tower finding its self sideways on the Suez Canal. Yes, a rollercoaster week, but understandable.
Is it all over for the oil bulls? The inflation theme has not gone away and positioning is probably much cleaner after such a volatile week. OPEC+, having maintained production cuts at higher prices last month, seems less likely to open the taps at current levels.
Last week's news focus on the Suez Canal blockage, identified by the EIA as a critical chokepoint for global energy flows, is delaying crude transit to the tune of 1.75mbpd. As mentioned on Wednesday, each day that passes increases the oil on water rather than in the refinery for processing as voyage times increase for those queueing for the canal or voyage distance and time increases as vessels re-route around Africa. Either way, it should help to re-tighten the physical market and stabilise prices.
Oil closed down about 0.7% on the week after a series of up/down days (see detail below). At the time of writing, the Ever Given remains stuck in the Suez Canal as efforts to dislodge it are ramped up. The prompt spreads hardly moved Friday, while the backwardation between the Dec21 and Dec22 expiries widened.
Up/down oil rollercoaster days (March 22-26)
- Monday unchanged
- Tuesday -6%
- Wednesday +6%
- Thursday -4%
- Friday +4%
Author

Stephen Innes
SPI Asset Management
With more than 25 years of experience, Stephen has a deep-seated knowledge of G10 and Asian currency markets as well as precious metal and oil markets.


