Oil Forecast 2017: Bullish view at risk of OPEC non-compliance, sharp rise in Shale output

The year 2016 is ending on a positive note for oil markets, courtesy of the first global output deal since 2001. WTI Oil has rallied almost 40% in 2016, while Brent oil has rallied almost 46%.
2016 Recap
The first nine months of 2016 were marked by repeated failure on the part of OPEC and non-OPEC members to come to common terms. ‘Doha Debacle’ in April showed the world the great divide inside the OPEC cartel as the major producers failed to reach production freeze agreement.
The sentiment was extremely weak as we approached the last quarter of 2016. Moreover, commentators were wondering if the OPEC has lost its credibility.
OPEC & Non-OPEC deal - The output cuts come into effect from January 1
OPEC agreed for the first time in eight years to cut the volume of oil its members produce. The group has decided to cut its output by 1.2 million barrels per day (bpd). The non-OPEC group headed by Russia agreed to cut output by 558K barrels per day. Some speculators think the first global oil deal may mark the beginning of the end of a two-year glut in the world’s oil markets.
Things to watch out for in 2017
OPEC & Non-OPEC compliance - Analysts believe full OPEC and non-OPEC compliance with the production cuts could see the oil price reach $65 by the next OPEC meeting in May, while a significant majority believes that increase in US shale supply in response to higher prices could see oil stabilize in the range of $55-$60.
However, OPEC does not have a great record of delivering on its promises. As per Goldman Sachs, “OPEC members have only met 60% of their production cut commitments over the seventeen agreements made since 1982.”
This means traders would have to keep an eye on the monthly output levels to see if the members are respecting the rules of the game. If OPEC overshoots, consider Russian retaliation as a done deal!
Another way (leading indicator) of a potential OPEC/non-OPEC compliance is to monitor oil-tanker traffic to ascertain whether are leaving port. OPEC tanker activity could be tracked, however, as per Natixis report, “traders cannot monitor Russia’s pledge to cut 300,000 b/d of production, because much of its production moves by pipeline”.
Shale production: That OPEC-led recovery in oil prices is a boon to US shale production is common sense. Goldman Sachs has warned the Saudis, “The US shale will respond”. More than 100 oil-service companies in North America went bankrupt since mid-2014. Over the next few months, the troubled driller and those projects which had gone off stream are likely to make comeback.
Thus, weekly Baker Hughes US oil rig count report released every Friday could trigger big moves in oil, and so would the weekly American Petroleum Institute data and the Department of Energy data.
Trump’s America-first energy plan: Trump’s America-first energy plan includes eliminating almost every impediment to the exploitation of oil, gas, and coal anywhere in the country or in its surrounding waters. Trump’s election campaign website said Trump’s top priority will be to "unleash America's $50 trillion in untapped shale, oil, and natural gas reserves, plus hundreds of years in clean coal reserves.
With OPEC and non-OPEC output cut deal, the stage looks set for Trump’s ‘drown-US-in-oil’ policies. Rick Perry as Trump’s energy Secretary and Rex Tillerson (ExxonMobil CEO) only strengthens the odds of a sharp rise in Shale output.
Don’t forget the demand side: There is widespread belief that Chinese growth of crude oil imports may likely shrink by more than 60 percent next year, as storage facilities are filling in and smaller refiners face more scrutiny over taxes and licenses.
Furthermore, India’s demonetization, though a long-term positive, could weigh heavily on growth/economic activity in H1 2017. Growth is likely to stay anemic at best in other parts of the world.
Plus, there are major political events across Europe, which could end up destabilizing markets. The demand side of the story could weaken further if due to any reason, the financial markets suffer a major bout of risk aversion.
Thus, it is quite clear that it is the supply side that has to do the lifting work. This indirectly means the focal point is - OPEC & non-OPEC compliance and Shale production.
To conclude - Stay bullish, but avoid sharp recovery hype
Overall, it makes sense to stay bullish on oil, but avoid betting on the sharp recovery hype. An OPEC-led rise in oil prices will most likely result in an increase in US shale output.
Oil prices could stay in the range of $50-$60 and average about $55 levels in the first six months of 2017.
Bearish scenario - Worst days are behind us, however, prices could fall back to $35-$40 range if the OPEC and non-OPEC deal falls apart.
Bullish scenario - Signs of a drop in OPEC output coupled with the lackluster response from shale producers could push oil prices beyond $60 a barrel.
Technicals - Bullish above 18-year long trend line
Brent oil monthly chart
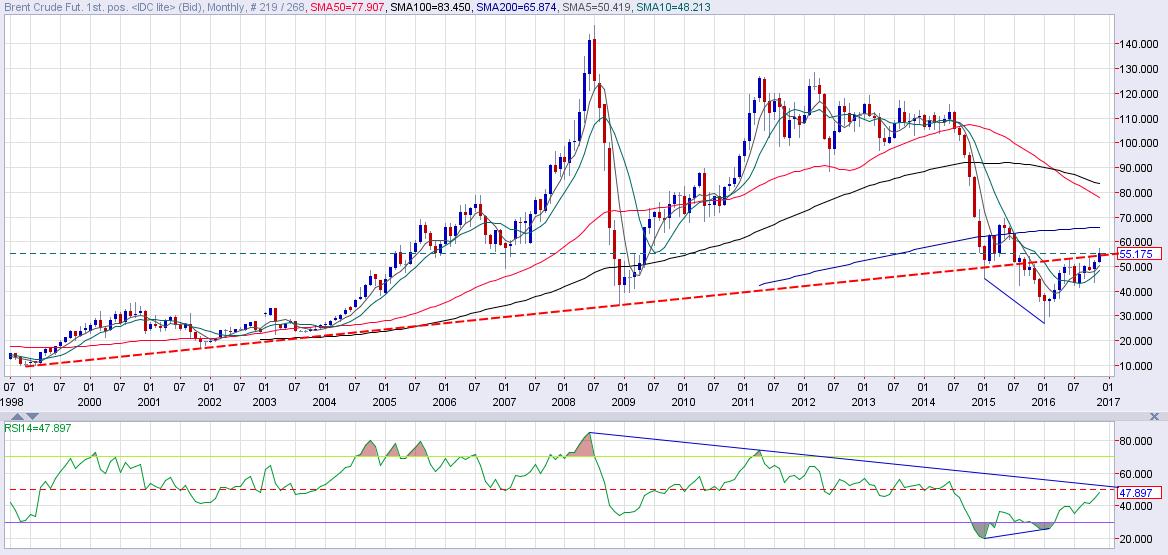
- A rising trend line drawn from Dec 1998 low and Nov 2001 low acted as a strong support in 2009 was breached in early 2015 and acted as a strong resistance in June 2016.
- The trend line resistance has been breached for now… however, what we need is a monthly close above the same, in which case the prices could see a sustained move towards $60-65.80 (monthly 200-MA).
- Also note, the RSI also is on the verge of a bullish breakout… The recovery from Jan 2016 low was on the back of a bullish price RSI divergence.
- Bearish scenario - Failure to stay above the trend line followed by a drop below $45.00 levels would signal a top has been made and could yield a sell-off to $35 levels.
WTI oil monthly chart
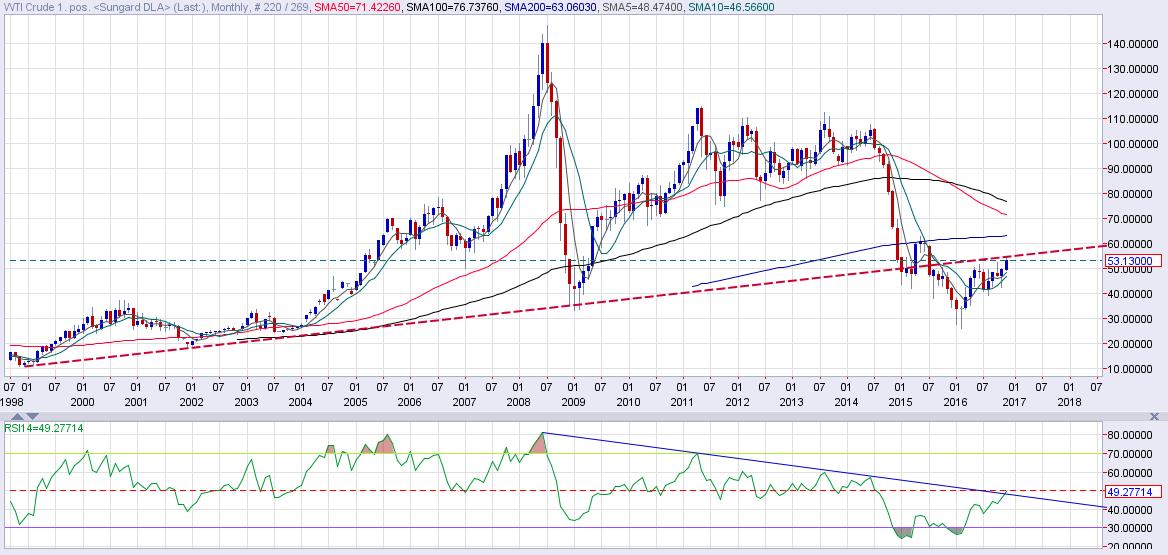
- The story is somewhat different here… in a sense that the RSI has breached the falling trend line… however, prices are yet to break above the 18-year long trend line hurdle.
- A bullish break would open doors for a test of monthly 200-MA seen at $63.06
- Bearish scenario- Failure to hold above the trend line followed by a break below $49.90 could yield a re-test of $39-$36 levels.
Author

Omkar Godbole
FXStreet Contributor
Omkar Godbole, editor and analyst, joined FXStreet after four years as a research analyst at several Indian brokerage companies.


