Markets consolidating with all eyes on the Fed
Market Overview
Financial markets are consolidating this morning, with all eyes on the Fed as the FOMC conclude their two day meeting with the announcement of monetary policy. This could be an historic meeting today. Even though there is no expectation of a rate hike, the meeting could include the official announcement that the Fed will begin to reduce the size of its balance sheet. Quantitative Easing by the world’s most important central bank has been seen as a supportive pillar for financial markets over the past nine years. The impact of the reversal of this process, through “Quantitative Tightening” could become an intriguing factor that plays out for years to come. The move has been well telegraphed by the Fed, starting slowly with $10bn reduction per month, ramping up every quarter, so the impact is unlikely to be a near term factor. The market reaction will not be on the balance sheet reduction, unless it is delayed (possible and dovish), or much faster than previously touted (highly unlikely and hawkish). The reaction will come more from the changes to the growth and inflation forecasts, along with the moves on the dot plots. Persistent low Inflation has been a problem for the Fed and this could be reflected in a lower average on the dot plots which could reflect a shallower tightening cycle, especially if the terminal interest rate is reduced from 3.0%. This would hit the dollar.

Wall Street closed at all-time highs yet again with the S&P 500 +0.1% at 2506, whilst Asian markets consolidated overnight with the Nikkei just +0.1% higher. In forex markets there is a mild sip for the dollar ahead of the Fed, with very slight underperformance across the majors, although there is little real conviction in any of the moves. Commodities markets show gold has been supported by the slight dollar weakness, whilst oil has also been supported amid suggestions that OPEC countries could be willing to extend the supply restraint.
Traders will be focused squarely on the Fed tonight, but first up there is the announcement of UK Retail Sales at 0930BST which are expected to be +0.2% for the month ex-fuel which would see the year on year data in line with July’s reading at +1.5% ( +1.5% last month). US existing home sales are at 1500BST and are expected to improve by +0.3% to 5.46m (from 5.44m last month). The EIA oil inventories are at 1530BST and are expected to show another crude oil build of +3.0m barrels (last week +5.9m), with distillates in drawdown by -1.4m barrels (-3.2m last week) and gasoline in drawdown by -2.0m barrels (-8.4m barrels last week). The main even though will be the Federal Open Market Committee monetary policy announcement at 1900BST, with Janet Yellen’s press conference at 1930BST. The Fed is not expected to hike rates this month, but the interest will come in the expected announcement of its balance sheet reduction, potential reduction in the “dot plots” and also expectations for inflation and growth.
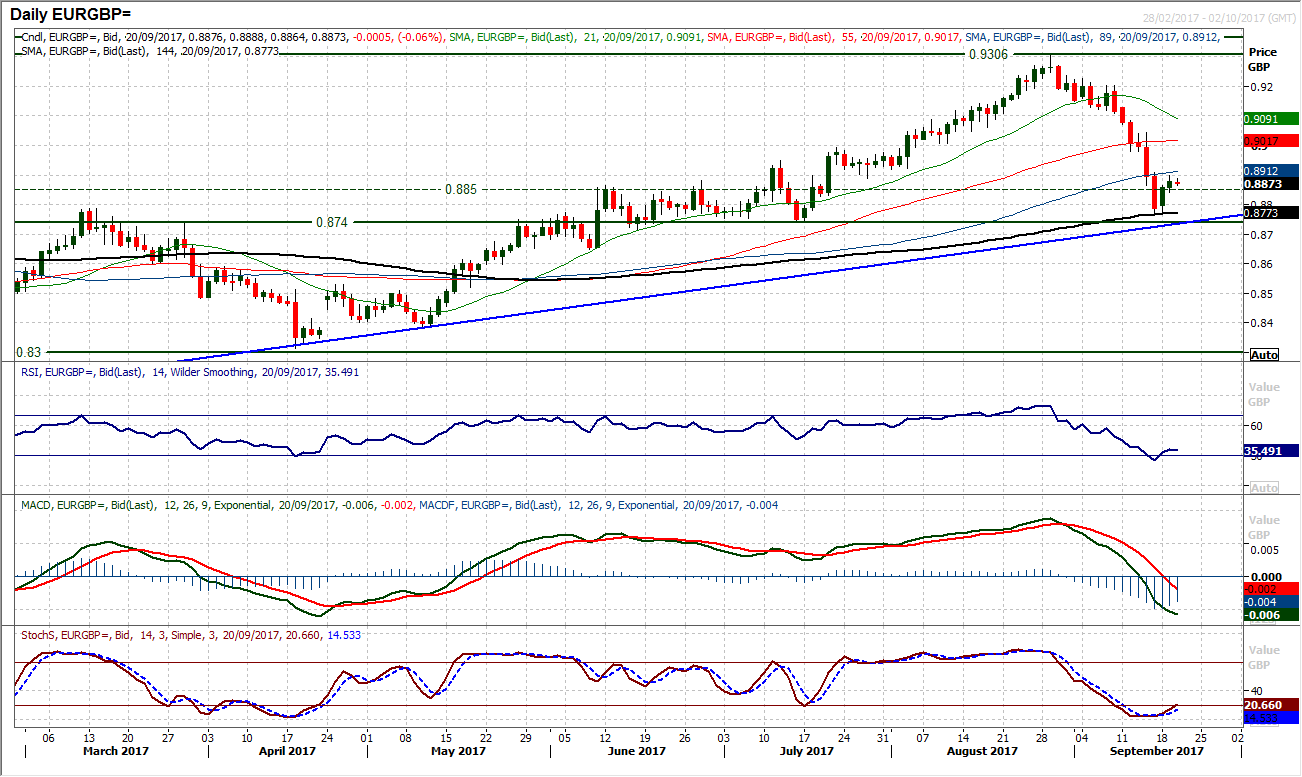
Chart of the Day – EUR/GBP
Hawkish BoE rhetoric and Brexit politics continue to be a key impact on sterling and the volatility will be ramped up with a key speech from Theresa May in Florence on Friday. However, after an incredible sterling rally, the market has started to settle down again. Has this unwinding move been a chance to buy? It is interesting to see that after a sharp correction from £0.9200 to £0.8800 in just over a week, the market was finding support on Monday. The support came in at £0.8772 which is just above key medium term support at £0.8740, which is also just above the key long term uptrend from November 2015 (currently at £0.8735). Bouncing back above £0.8850 will be seen as a key move for the euro bulls, whilst momentum indicators are also turning positive once more. The RSI bouncing from 25 back above 30 is a near term buy signal, whilst the Stochastics are also turning higher. The confluence of lows and supportive indicators formed this week could now become the basis of key medium term support and a higher low above £0.8772 will be important. Initial resistance is at yesterday’s high at £0.8900, which on the hourly chart shows as a small potential base pattern. Subsequent resistance in at £0.9000.
EUR/USD
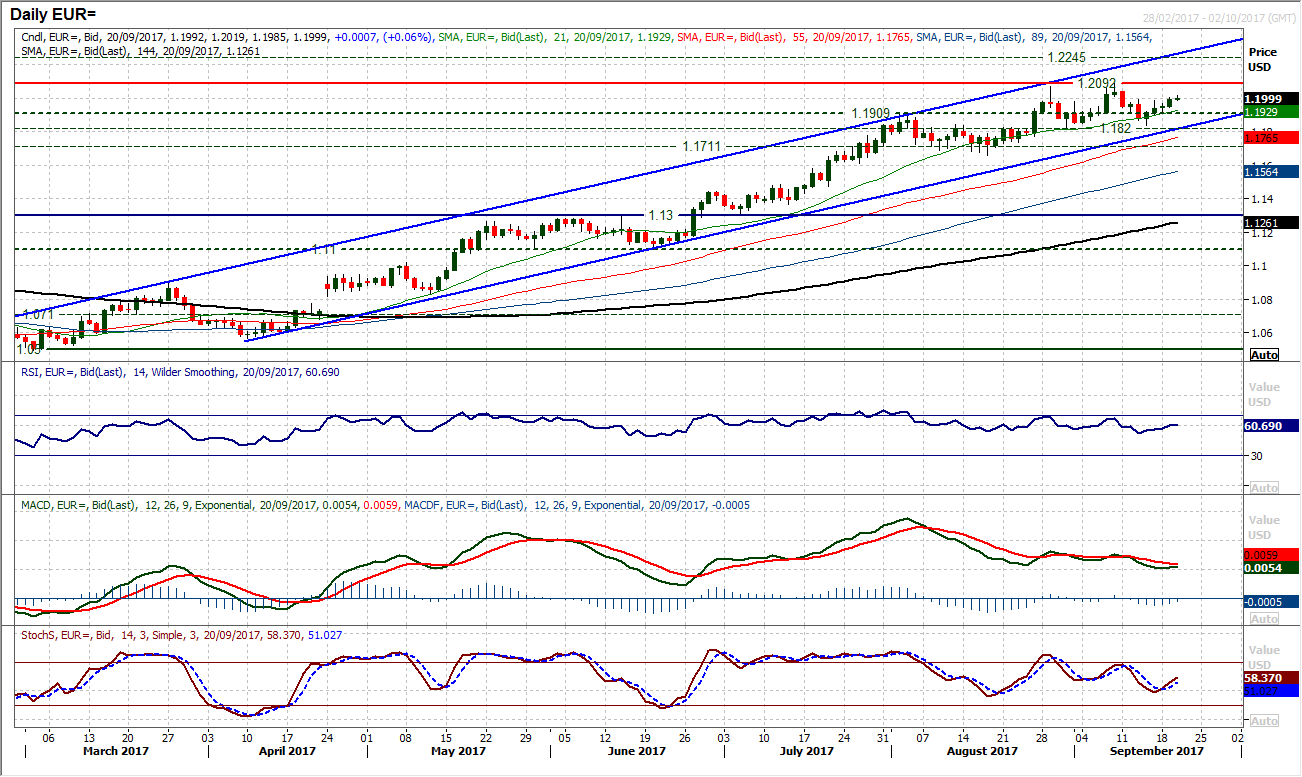
Even with the Fed meeting imminent, EUR/USD continues to drift higher. The pair has now posted a fourth consecutive positive candle and also broken back above $1.2000 near term resistance again today. This move has now re-opened the key high at $1.2092 which is the highest level since January 2015. Momentum indicators remain positively configured with the RSI rising above 60, whilst the Stochastics are also improving again. However the FOMC meeting today will be key for the near to medium term outlook. A hawkish Fed means that levels to watch as support come in at $1.1820 with the uptrend channel also at $1.1820 today. The market turns corrective below $1.1660. For a dovish Fed the bulls will be eying $1.2092 initially but the next resistance is not until $1.2245.
GBP/USD
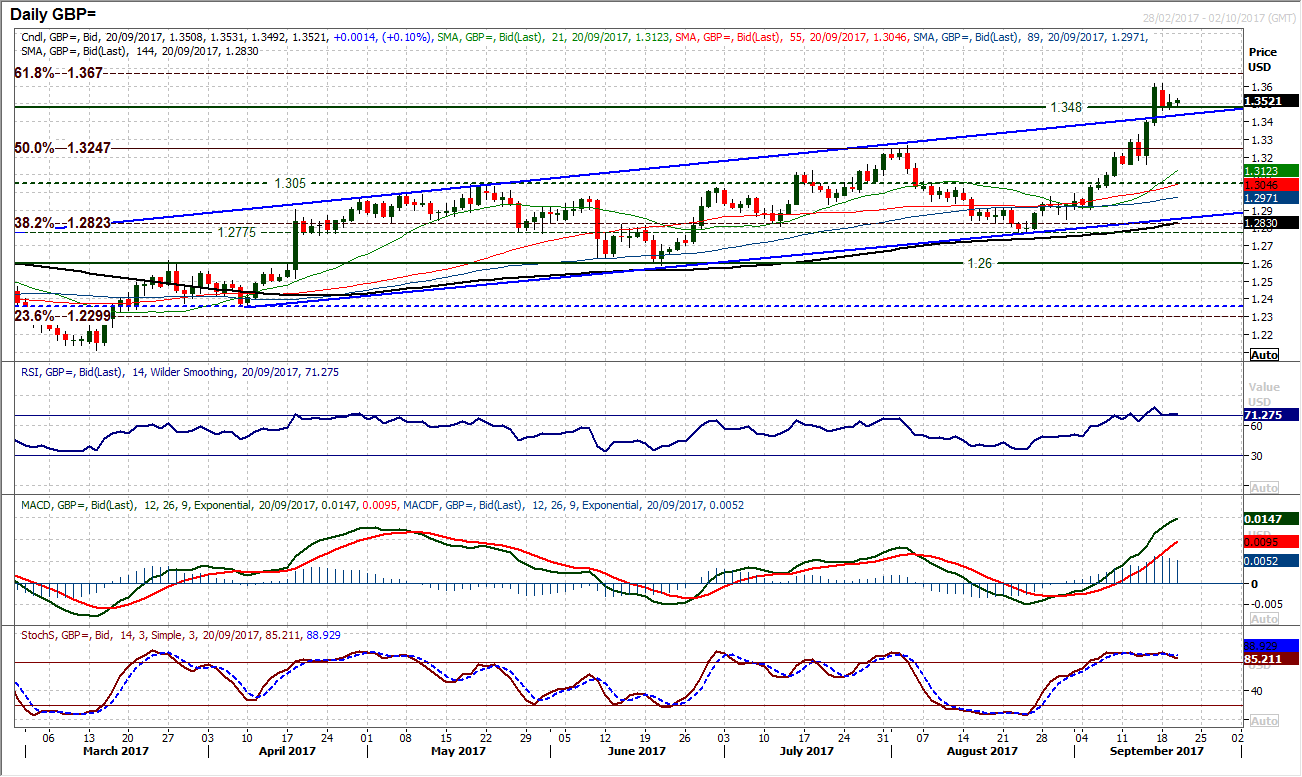
The market is consolidating in front of the Fed tonight. The sharp increase in volatility of the breakout in the past week is now looking to use the old breakout support at $1.3480 as a basis of support. Yesterday’s small bodied candle looks to suggest that the market may be settling down, but this is likely to be a brief interlude as the market prepares for the Fed tonight. Technically, Cable remains strong with positively configured momentum indicators, even though they may have begun to plateau. However the direction will be taken from the FOMC. A hawkish move will drive an unwind of the market. The uptrend channel breakout becomes supportive initially at $1.3435 today. However a retreat to the 50% Fibonacci retracement of the Brexit sell-off of $1.5040/$1.1450 comes in around $1.3250 which is around the support of an old high breakout at $1.3265. On the dovish side, the $1.3618 high from Monday would be in play, with the 61.8% Fib retracement at $1.3670, however there is little real resistance until $1.3835 and then $1.4000.
USD/JPY
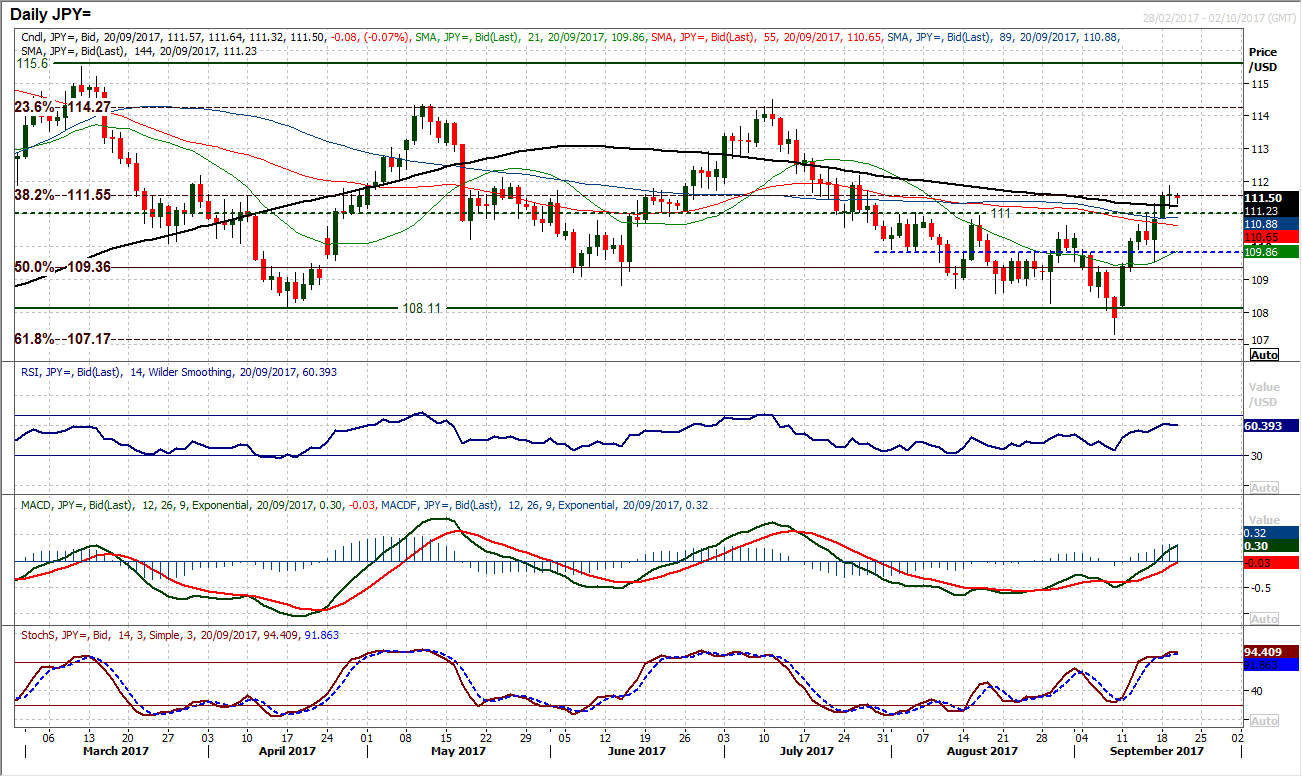
The market turned far more positive on a move above 111.00 this week. The removal of this key near term ceiling has been a key development for the bulls. However there now needs to be another higher low posted to confirm the move. The key reaction low at 109.55 last Friday means that a higher low in the 110.60/111.00 band of support would be ideal. The technicals are improving with momentum indicators turning increasingly positive, but the Fed will drive an increase in volatility tonight. The market is subsequently looking to consolidate in front of the decision. Yesterday’s doji candle indicates caution, something that is being reflected in the early move today. Holding on to the breakout support band 110.60/111.00 will be key in the wake of tonight’s decision. A dovish Fed would put this improving outlook in jeopardy. A hawkish move would continue the recovery, with initial resistance of yesterday’s high at 111.87, before old lower highs from the July/August sell-off come in at 112.20 and 113.55.
Gold
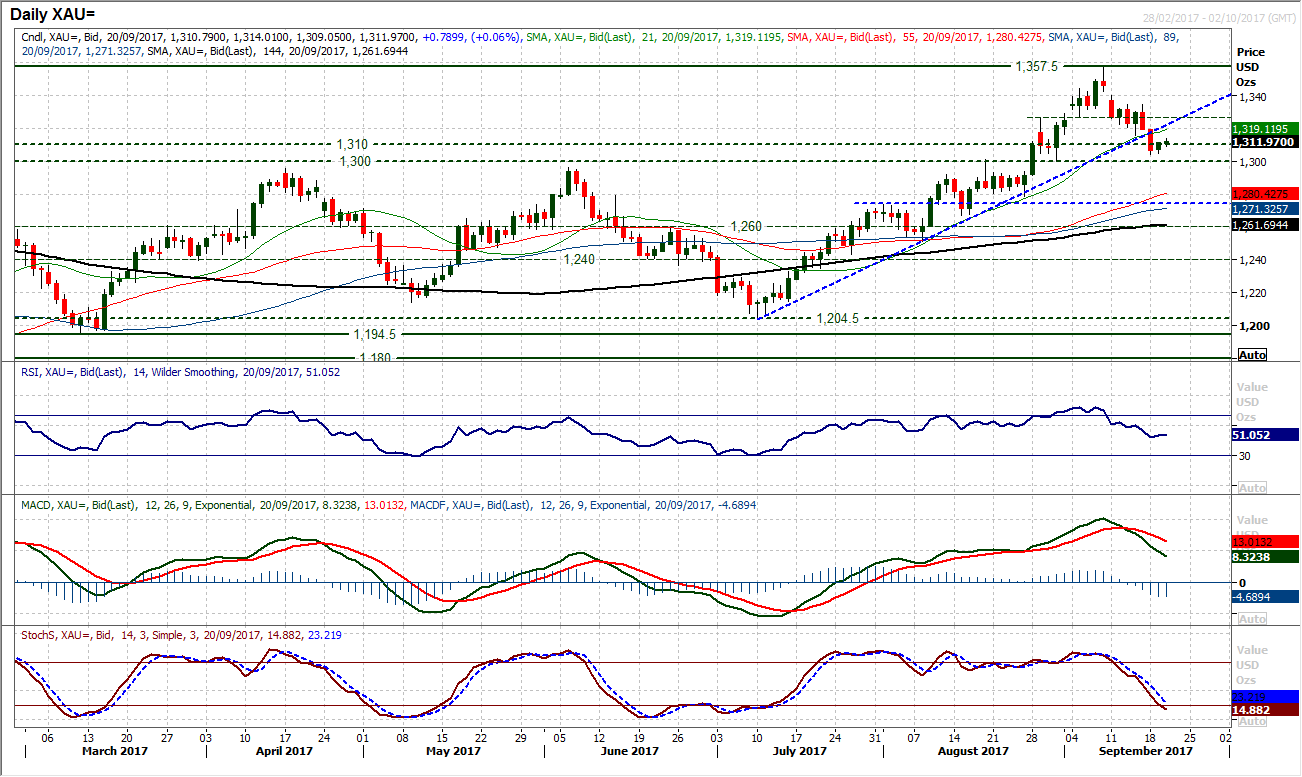
This week’s breaking of the 10 week uptrend and 21 day moving average has really increased the downside pressure. So far the key support band $1300/$1310 is holding, but will this continue to be the case after the Fed tonight? Monday’s low at $1304 held yesterday with a mildly positive candle, a move that has been sustained early today as the dollar has slipped. However “the trend is your friend until it ends” and the medium term trend has now been broken. The underside of the old uptrend now becomes a basis of resistance as does the 21 day moving average at $1319. Momentum indicators still look corrective with MACD and Stochastics still falling. Another failure below $1334 would also be a further lower high. A hawkish Fed move tonight would put $1300 under significant strain now.
WTI Oil
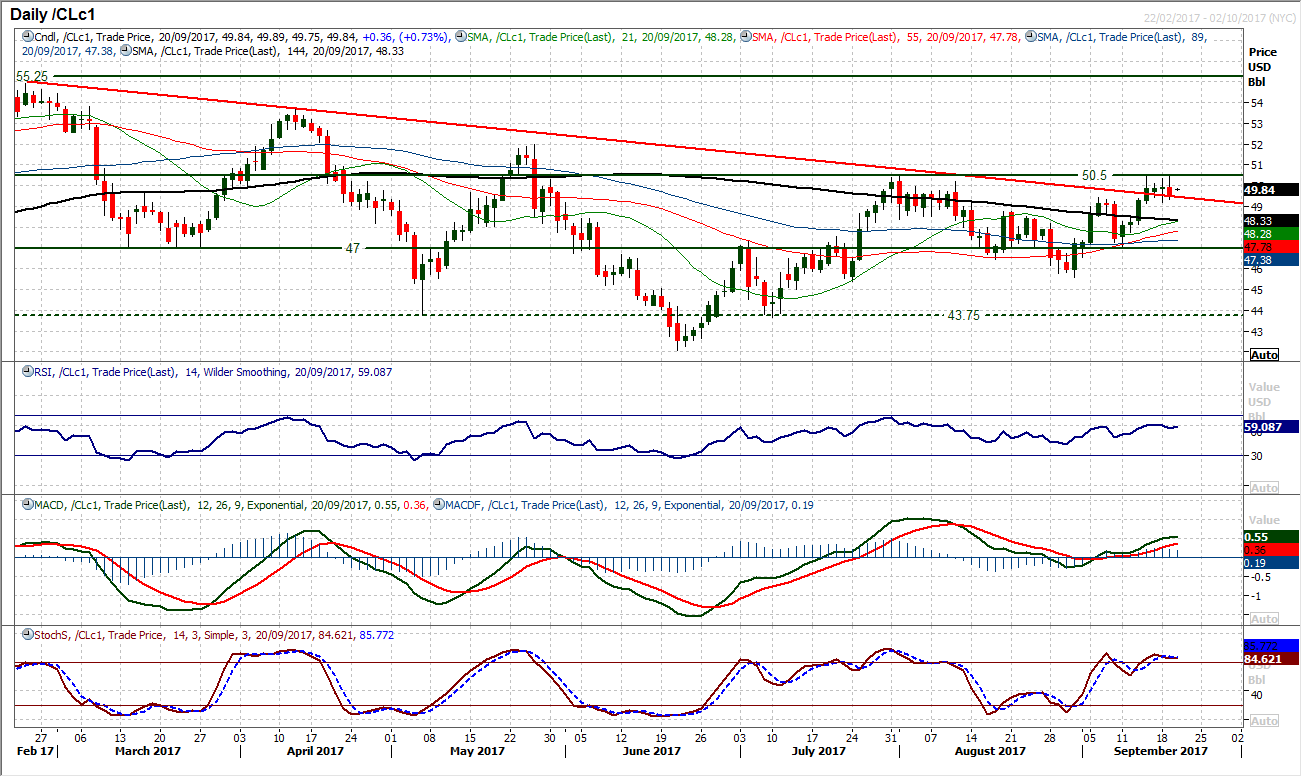
The consolidation continues as another move has failed to make the push above $50.50. There is though still a bullish bias and suggestion that there will be pressure for an upside breakout above $50.50 in due course. Momentum indicators remain strong with the MACD and Stochastics strongly configured and RSI pushing into the 60s. The hourly chart continues to show $49.25/$49.40 is a basis of support near term as the market has developed into a near term consolidation $49.25/$50.50. Whilst the market holds above $48.80 would be positively configured.
Dow Jones Industrial Average
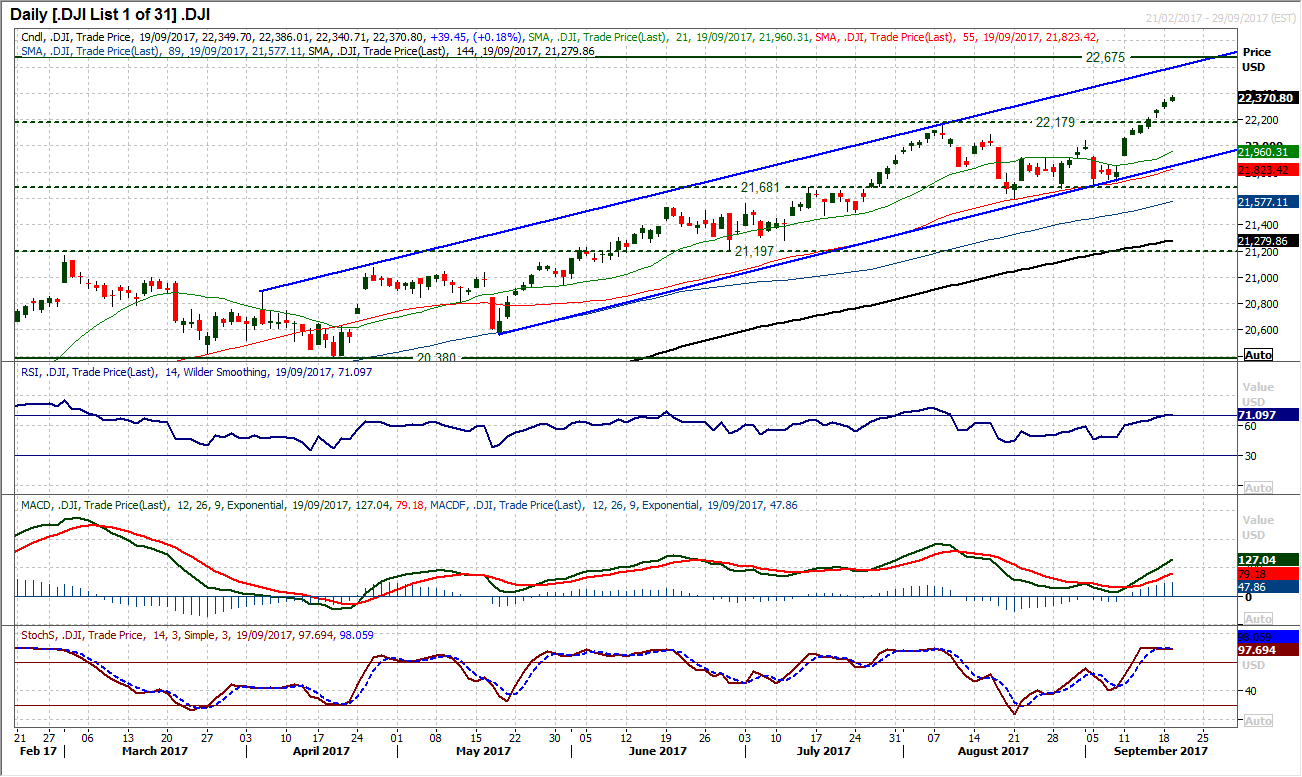
Another push into all-time high ground continues the upside breakout that implies a target of 22,675. The bulls retain strong momentum configuration with the daily chart showing MACD lines accelerating higher, strongly positioned Stochastics and the RSI pushing above 70. This is a trending move from the Dow, so the fact that the RSI is pushing into the 70s should not be restrictive. This was the case with the February breakout that lasted for 3 weeks with the RSI above 70, whilst the August breakout saw the RSI above 70 for over a week. Intraday corrections are a chance to buy, with initial support at 22,321 and then the breakout at 22,179.
Author

Richard Perry
Independent Analyst


