![]() Richard Perry
Richard Perry
Independent Analyst
Market Overview
After a brief period of calm, suddenly traders are finding protectionist fears are resurfacing again. The move by Donald Trump to sack his Secretary of State, Rex Tillerson, may have been broadly understandable given their differences of opinion on several key areas (including North Korea and Iran). However, the chaotic nature of sacking the man via the medium of Twitter, and replacing him with a foreign policy hawk such as Mike Pompeo has increased concerns of how Trump will progress now. Suggestions are that Trump is preparing tariffs of perhaps $60bn on Chinese imports. This would be a significant blow to global trade and the knock-on impacts could be significant. Global market risk appetite has been duly hit. Treasury yields have fallen away, with the 10 year yield around 2.83% and closing in on the recent reaction low of 2.79% (although subdued CPI inflation may also have had a part to play in this move). Equities have sold off also and the US dollar has come under renewed selling pressure. However, after initial moves yesterday there is a sense of calm (or should that be uncertainty) returning today. However, forex markets have been somewhat directionless of late, waiting for a catalyst. Perhaps now traders now have their excuse to sell the dollar once more. Chinese economic data overnight has been strong with China Industrial Production well ahead of expectations at +7.2% (6.1% exp, 6.2% last), whilst China Retail Sales also improved to +9.7% (+9.8% exp, 9.4% last) and Fixed Asset Investment was +7.9% (+7.0% exp).

Wall Street closed strongly lower with the S&P 500 -0.6% at 2765 with Asian markets also lower with the Nikkei off by -0.9%. European markets are cautious but interestingly settled in early moves. In forex there seems to be a lack of intent this morning with almost no direction other than early Aussie gains. In commodities there is also a lack of direction with gold all but flat and oil also barely moving.
Traders are currently listening to Mario Draghi who is speaking at an ECB conference in Frankfurt. However on the economic data front the big focus for the day is US Retail Sales at 1230GMT which are expected to show US Core Retail Sales (ex-autos) growing by +0.3% for the month. US core PPI is also at 1230GMT and is expected to increase to +2.5% (from +2.2% last month). The EIA oil inventories are expected to show crude stocks again rising by +2.0m barrels (+2.4m last week) whilst distillates are expected to again be in drawdown by -1.25m (-0.6m last week) and gasoline stocks are expected to drawdown by -2.0m (-0.8m last week).
Chart of the Day – EUR/JPY
The yen is coming against an increase in pressure across several of the major currencies and EUR/JPY is close to a key breakout. For over seven months now there has been a key pivot band that has formed between 131.15/132.00. Having broken back below the pivot in early March as part of the yen strengthening, it looked as though the market was making a key downside break. However the big bullish engulfing/key one day reversal just over a week ago flipped the outlook around. The market has been subsequently bumping up against the resistance of the 132.00 pivot. As the yen has been weakening the market broke out intraday yesterday on a strong bull candle. Although the market could not quite close above the pivot, the euro is strengthening as the yen is looking more corrective and this could mean a close above 132.00. The momentum indicators are certainly calling for it, advancing strongly with the MACD lines having crossed for a buy signal and the Stochastics posting a bull kiss. If the market can close above 132.00 the bulls will be eying a continued recovery, with initial resistance at 133.05. It is interesting to see the 131,15 pivot acting as the basis of support yesterday. The hourly chart also shows that an inverted head and shoulders reversal pattern has also been completed which would imply a recovery target of 265 pips towards 134.65 is now on. With the neckline now supportive at 132.00 there is a near term buy zone for any correction now at 131.10/132.00.

EUR/USD
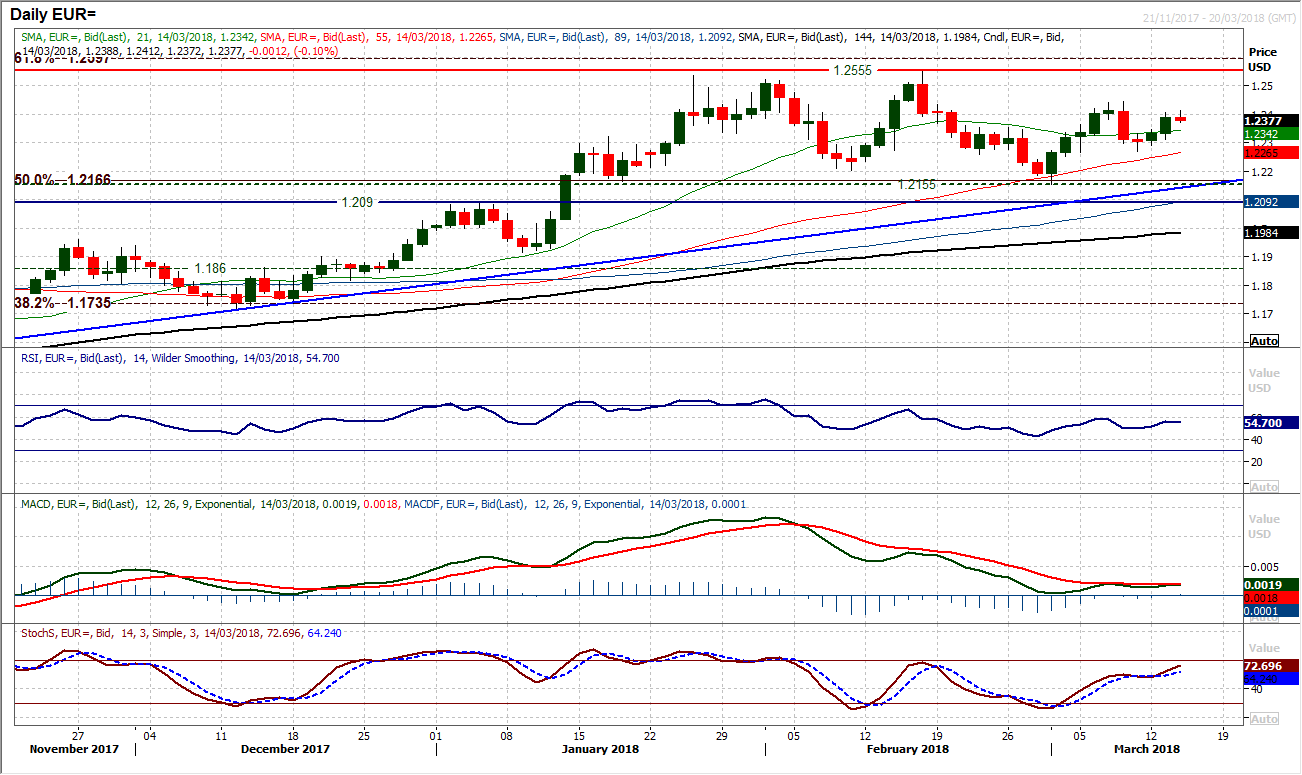
The dollar was hit from two angles yesterday (inflation failing to pick up and Trump firing Tillerson) in a move that resulted in a solid positive candle forming on EUR/USD. The result is that what seemed to be a chart searching for direction has had the bulls pulling higher. Momentum indicators are once more ticking higher and the market is eying a test of overhead resistance. As yet this is not a decisive move by the bulls though, there would need to be a move above $1.2445 for that, however there is an improving look to the chart once more. The hourly chart shows more positive momentum configuration and importantly a move above the near term pivot at $1.2360 which becomes a basis of support now for any intraday corrections. Initial resistance at today’s early high at $1.2412, but above $1.2445 opens $1.2555 again.
GBP/USD
With the dollar back under pressure and sterling supported, three bull candles have helped Cable to break higher from its recent corrective phase. The resistance of a six week downtrend has now been breached by this move. The momentum indicators are also taking on a far more positive configuration as the Stochastics rise strongly, the RSI pulls above 50 and the MACD lines are now in the process of posting a bull cross. The move above resistance at $1.3930 yesterday re-opened the psychological $1.4000 level which has been tested yesterday and again today. The concern is that the market seems to be unable to break back above $1.4000 and it is a near term pivot level barrier. Despite this though the hourly chart shows there is support around $1.3930 now and it will be interesting to see how the bulls build from here. Hourly indicators also suggest corrections are now a chance to buy. The late February high at $1.4070 is the next key resistance to test.

USD/JPY
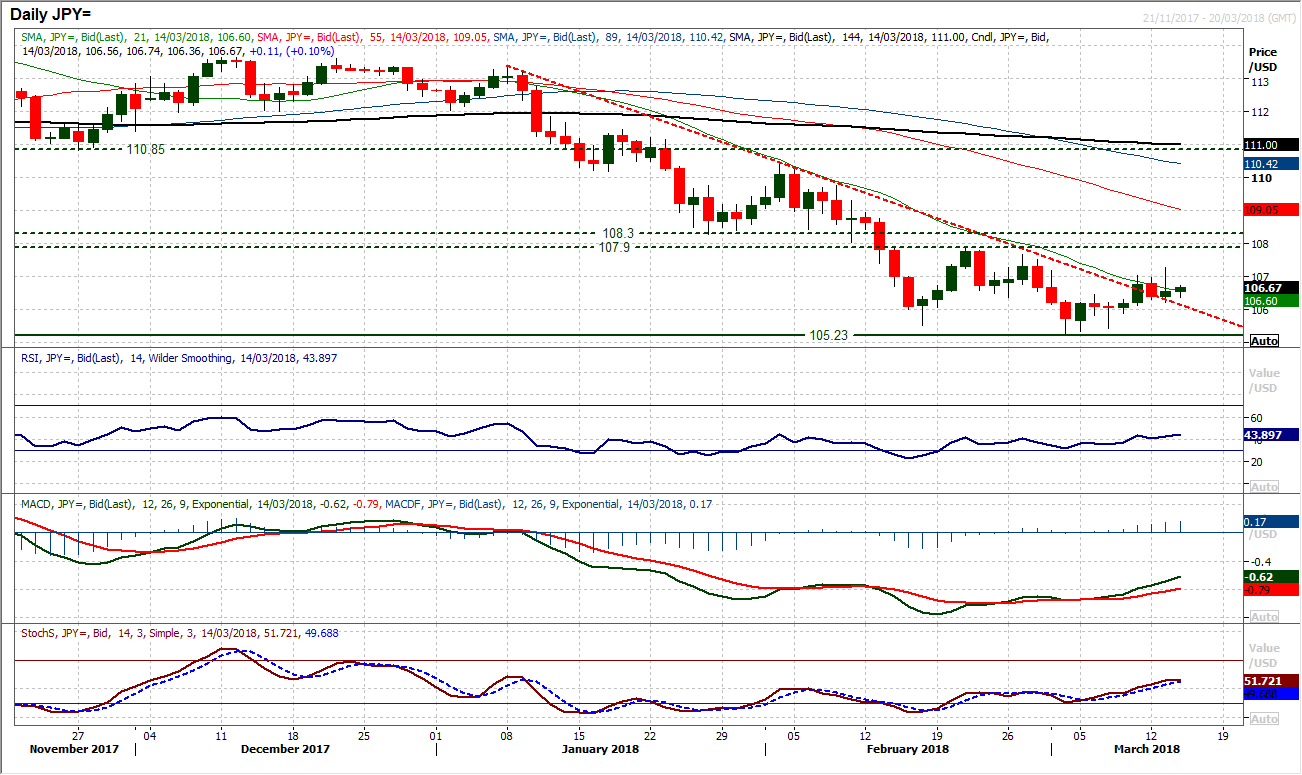
It has been a real stop/start recovery on Dollar/Yen and once more just when it looked as though the dollar was decisively picking up, the reins are pulled back on the rally. The eight week downtrend is broken and momentum indicators are in recovery mode. The MACD lines are improving well (MACD is considered to be more of a steady hand compared to the more volatile Stochastics) but more needs to be done. In the least the bulls need to hang on to a near term breakout above 106.35 which has been a pivot and become a basis of support latterly. Yesterday’s candle is a mixed outlook, posting gains on the day but a disappointing pullback from the bulls which has left resistance at 107.30. The reaction today on the pair could be very important to the near to medium term outlook as renewed support around 106.35 would embolden the bulls for a rebound. A close back below 106.35 would be a disappointment which would open 105.90 initially and support around 105.50 again.
Gold
Take a step back and the chart of gold looks to be very dull in the past week. Momentum indicators on the daily chart are rather neutrally configured and the candlestick bodies are very small. There has been a tick higher in gold into the close last night which has improved what threatened to be a deteriorating chart once more. The last three candles have long lower shadows which suggests the market has been consistently testing lower, but every time the bulls have responded. This has left support around $1313/$1316 to help protect the key long term pivot band $1300/$1310. However the bulls are not by any means running higher today and there is still an air of uncertainty (given the early doji candle too), whilst the hourly hart shows resistance around $1329/$1330 forming. It needs a break above $1341 for the bulls to regain real control of the market.

WTI Oil
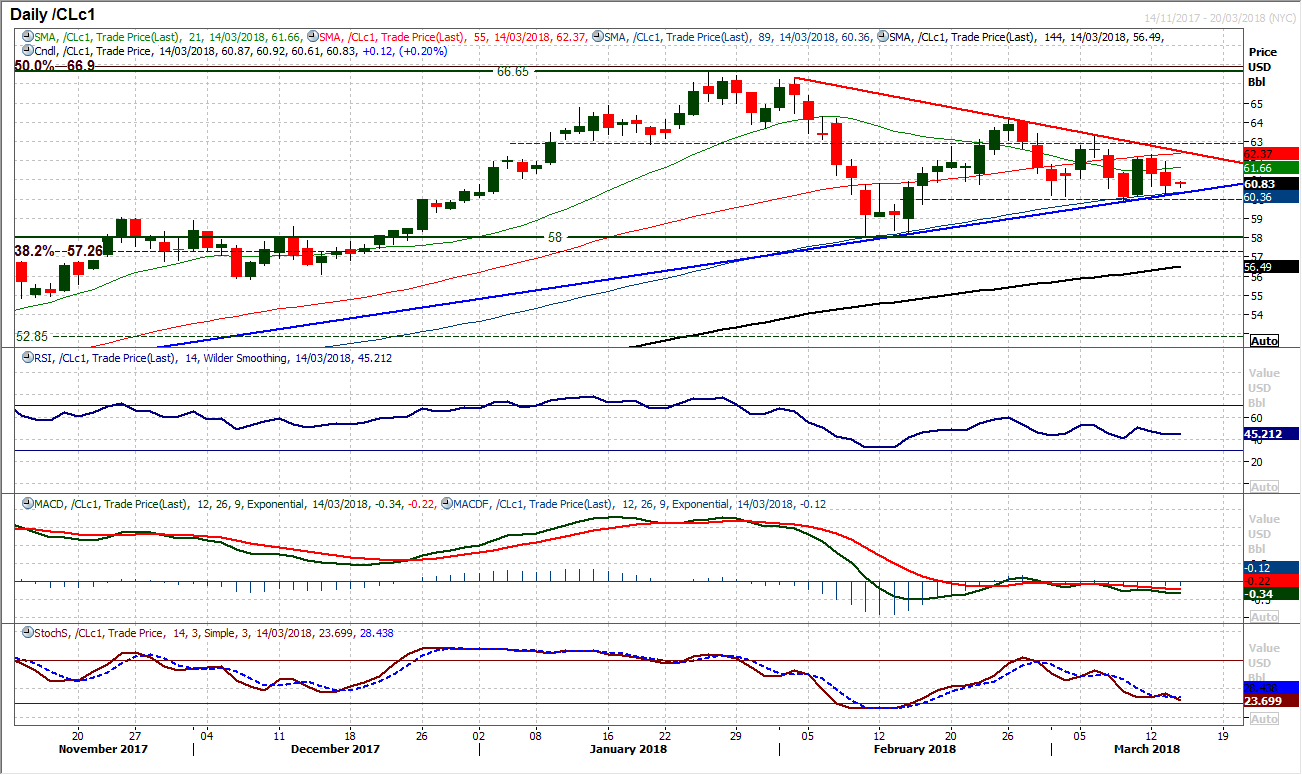
The bulls again felt the pressure yesterday as another intraday rally was sold into. There is now increasing pressure on the support of a six and a half month uptrend and the rising 89 day moving average. With the momentum indicators tailing off there is risk of a break back below the recent reaction low at $59.95 which would then open the key February low at $58.05. The hourly chart may show a somewhat choppy period of trading as reflected on the oscillating momentum indicators, however there is a series of lower highs which shows the market increasingly selling into strength. Yesterday’s latest lower high at $61.97 is now a basis of resistance.
Dow Jones Industrial Average
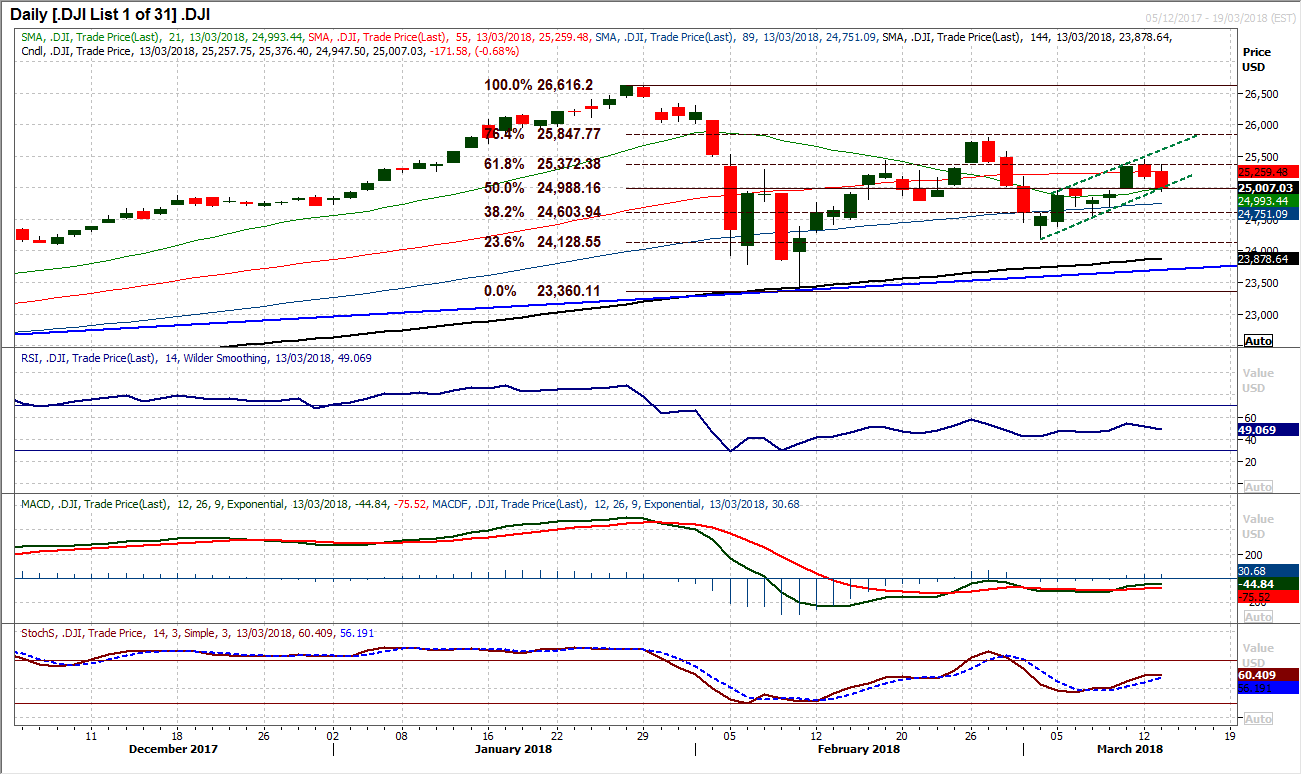
The near term mini uptrend channel is still a positive influence on the market as the trend of the past eight sessions builds higher. However, with a second negative candle, the trend support is now coming under pressure. There needs to be a positive session today to prevent the channel being broken, as it comes in around 25,100 today. However it is becoming interesting how the Fibonacci retracements of the big sell-off are playing a key role in the near term turning points. The past three sessions have been capped around the 61.8% Fib level at 25,372 (having had Monday’s high at 25,449), whilst the 50% Fib level at 24,988 is a basis of support with yesterday’s session low and closing level both very close. If the mini trend channel can continue to pull the market higher there is still a positive outlook, but the negative daily candlesticks of the last couple of sessions are a concern. The hourly chart shows this retreat is an unwind within the recovery but the bull needs to step up today.
Note: All information on this page is subject to change. The use of this website constitutes acceptance of our user agreement. Please read our privacy policy and legal disclaimer. Opinions expressed at FXstreet.com are those of the individual authors and do not necessarily represent the opinion of FXstreet.com or its management. Risk Disclosure: Trading foreign exchange on margin carries a high level of risk, and may not be suitable for all investors. The high degree of leverage can work against you as well as for you. Before deciding to invest in foreign exchange you should carefully consider your investment objectives, level of experience, and risk appetite. The possibility exists that you could sustain a loss of some or all of your initial investment and therefore you should not invest money that you cannot afford to lose. You should be aware of all the risks associated with foreign exchange trading, and seek advice from an independent financial advisor if you have any doubts.
Recommended Content
Editors’ Picks

EUR/USD consolidates weekly gains above 1.1150
EUR/USD moves up and down in a narrow channel slightly above 1.1150 on Friday. In the absence of high-tier macroeconomic data releases, comments from central bank officials and the risk mood could drive the pair's action heading into the weekend.

GBP/USD stabilizes near 1.3300, looks to post strong weekly gains
GBP/USD trades modestly higher on the day near 1.3300, supported by the upbeat UK Retail Sales data for August. The pair remains on track to end the week, which featured Fed and BoE policy decisions, with strong gains.

Gold extends rally to new record-high above $2,610
Gold (XAU/USD) preserves its bullish momentum and trades at a new all-time high above $2,610 on Friday. Heightened expectations that global central banks will follow the Fed in easing policy and slashing rates lift XAU/USD.

Week ahead – SNB to cut again, RBA to stand pat, PCE inflation also on tap
SNB is expected to ease for third time; might cut by 50bps. RBA to hold rates but could turn less hawkish as CPI falls. After inaugural Fed cut, attention turns to PCE inflation.

Bank of Japan set to keep rates on hold after July’s hike shocked markets
The Bank of Japan is expected to keep its short-term interest rate target between 0.15% and 0.25% on Friday, following the conclusion of its two-day monetary policy review. The decision is set to be announced during the early Asian session.

Moneta Markets review 2024: All you need to know
VERIFIED In this review, the FXStreet team provides an independent and thorough analysis based on direct testing and real experiences with Moneta Markets – an excellent broker for novice to intermediate forex traders who want to broaden their knowledge base.