Key trading set-ups that can define global sentiment

Calm has descended over markets in Asia as investors and where traders eye new news to spur them back to life.
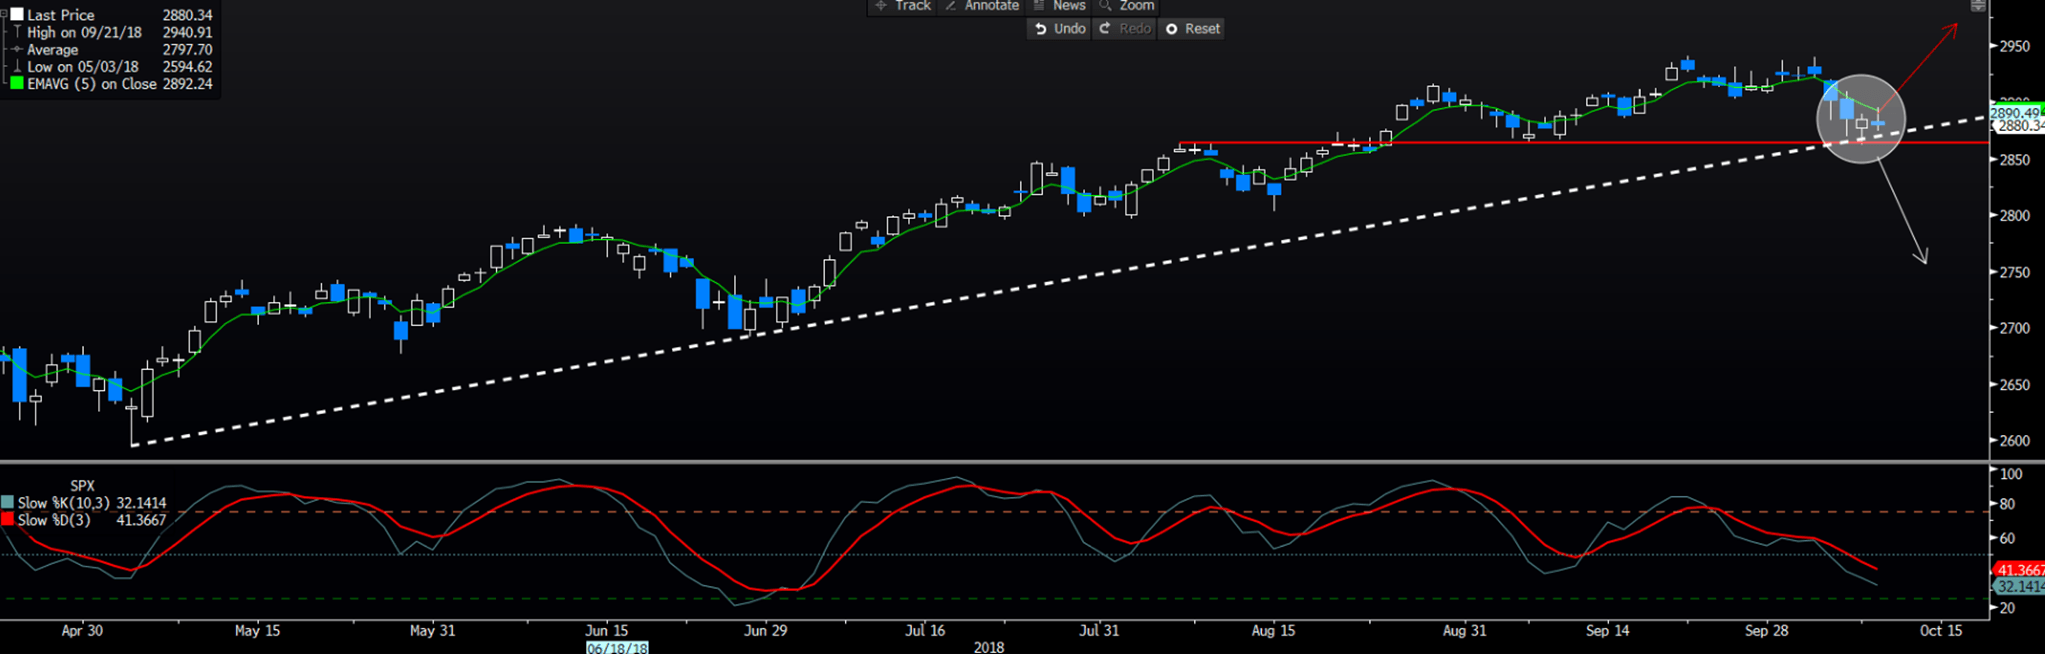
There are a number of charts that highlight the juncture we find ourselves in right now, but two that really stand out are the daily chart of the S&P 500 and the US 30-year Treasury. As we can see, the next move may start a new trend in price, and both are on the ‘high watch’ list. As detailed yesterday, the S&P 500 sits on a confluence of support levels and a move higher, presumably driven by inspiring earnings outlooks through the corporate reporting season, will confirm a buy signal in the various oscillators. As it stands, we are not quite there yet, and a touch more technical work needs to play, and while I felt the index could trade lower, we can see evident indecision in the price action and that needs to be respected.
The fact is, the index has had to deal with a 40-basis point move higher in the US 10-year (in the past 33 sessions), at a time when companies have had a freeze on share buy-backs, and the pullback has been limited at 2.6%. Of course, the more significant drawdown has been seen in small caps and tech names. However, it feels as though this benchmark goes higher, and a move through the five-day EMA would give me greater confidence here, as would a close through the all-time high of 2940.
If we look at the daily chart of the VIX index (implied volatility in the S&P 500), we can see traders selling volatility (vol) into spikes, and although this index sits at 15.95%, traders love selling vol, and if vols can push towards 13%, then the S&P 500 goes higher. Of course, if vols head towards 18% to 20%, then cash levels will be raised in portfolios, and the S&P 500 will trade through key support at 2864.
(Daily chart of S&P 500)
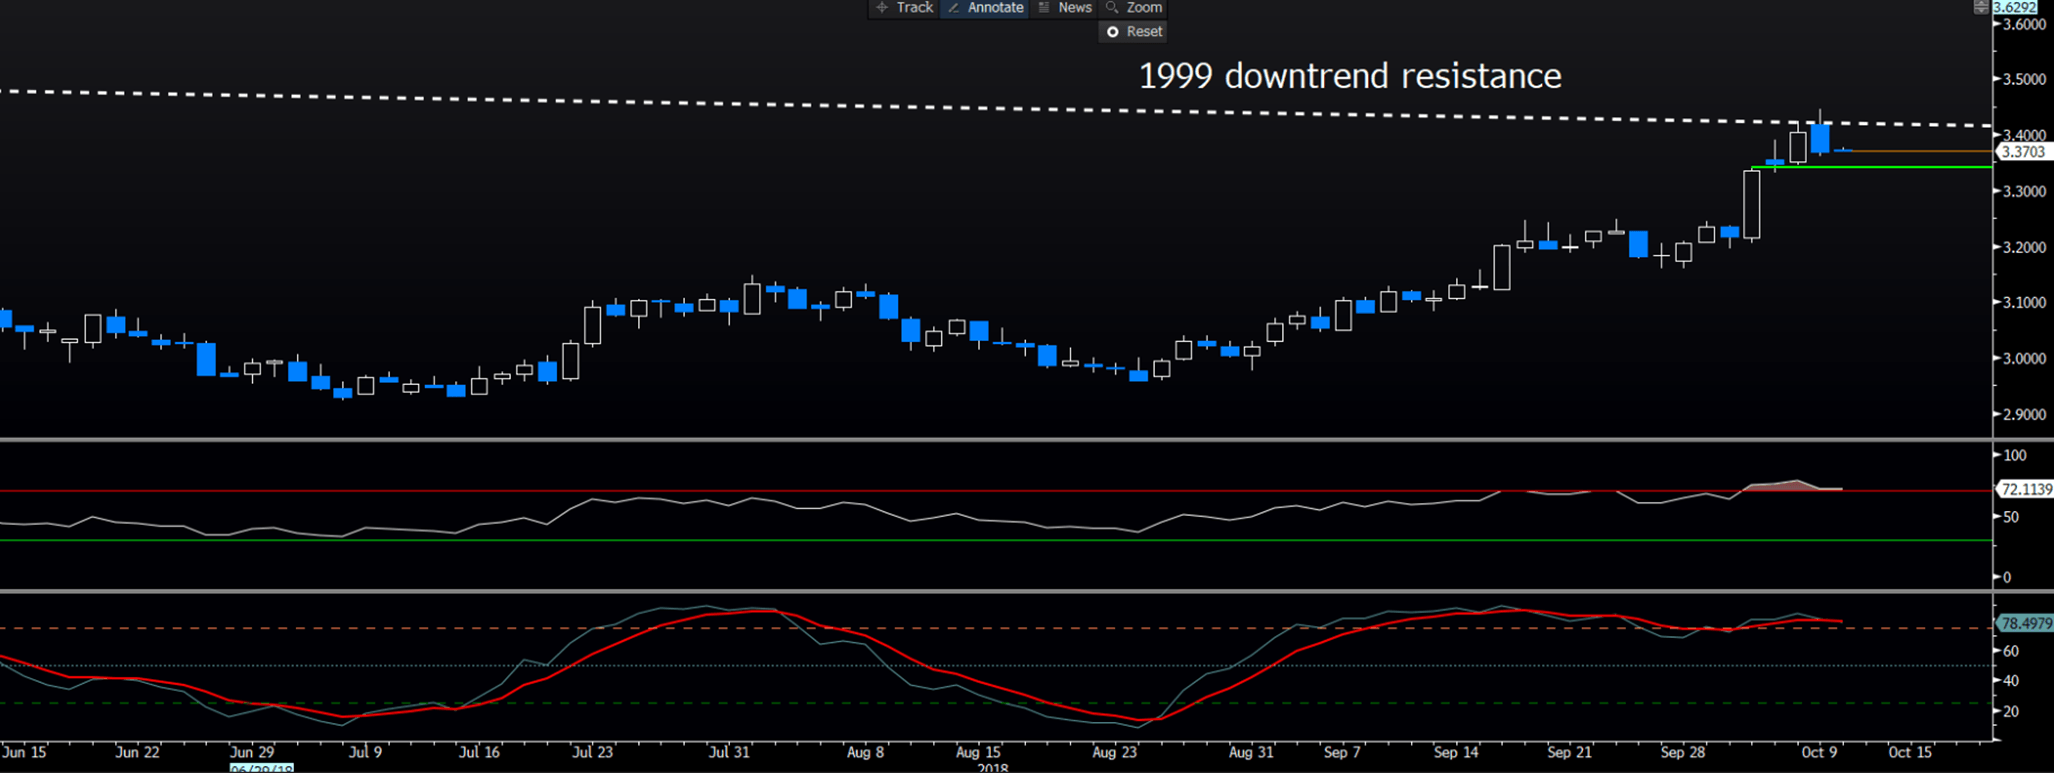
The US 30-year Treasury has found buyers off the 1999 downtrend, closing out yesterday’s US cash session 4bp lower at 3.36%. As we can see from various oscillators, the recent move was extended and overdone, so the slight move lower was merely the air coming out of the market’s tyres. With $36b of 3-year and $23b in 10-year Treasuries being auctioned through US trade, the demand here should resonate through the yield curve. So, while many feel this additional supply should act as a headwind for yields, if we see robust demand, notably from foreign buyers, then we could see yields lower, and this could result in improved sentiment to hold tech stocks, while the USD may find sellers easier to come by.
(30-Year UST)
Tomorrows (23:30 aedt) US core CPI print is another clear consideration, where the market looks for 2.3% YoY (analyst range - 2.3% to 2.2%), with headline inflation expected to fall 30bp to 2.4%. With Average Hourly Earnings likely to break the 3-handle at the next payrolls report, we could be facing the somewhat confusing dynamic of rising wages but weaker consumer prices - although that may change to an extent with the impact of tariffs.
So, a move below 3.20% in 30’s (US Treasury’s) and 3.18% in 10’s, would be felt in the USD, and this may lead to a slight reprieve for Emerging market equities and currencies. On the four-hour chart, we can see USDJPY has found buyers into ¥112.80, where a break here takes the pair into ¥112.49 (the 50% retracement of the September to October rally), ahead of ¥111.97.
AUDUSD was the best performing G10 currency yesterday and should outperform if EM markets push higher on the aforementioned dynamics. Price has pushed above the 11 September low of $0.7085, the 5-day EMA at 0.7108 and into the line of best fit drawn from the January at 0.7127. With the market so short AUD one does question if now is the time to see a squeeze higher, although any move will be premised on a pure position adjustment (from the AUD shorts) with limited organic buying.
For AUDUSD to move into 72c, we need to see a stronger CNY, so another variable to focus on here is USDCNH and USDCNY. USDCNH looks pretty bullish here, and the fact the PBoC ‘fixed’ the CNY mid-point at 6.9072 (+53 pips) today, which is higher than what the market was looking for suggests the time to fade this rally not now. That said, tactically the upside seems capped as the PBoC will want to run a stable, if not slightly stronger CNY into the US Treasury report in the next couple of weeks. So, while I suggest moves in UST yields could influence the USD, USDCNY will also be a clear driver too.
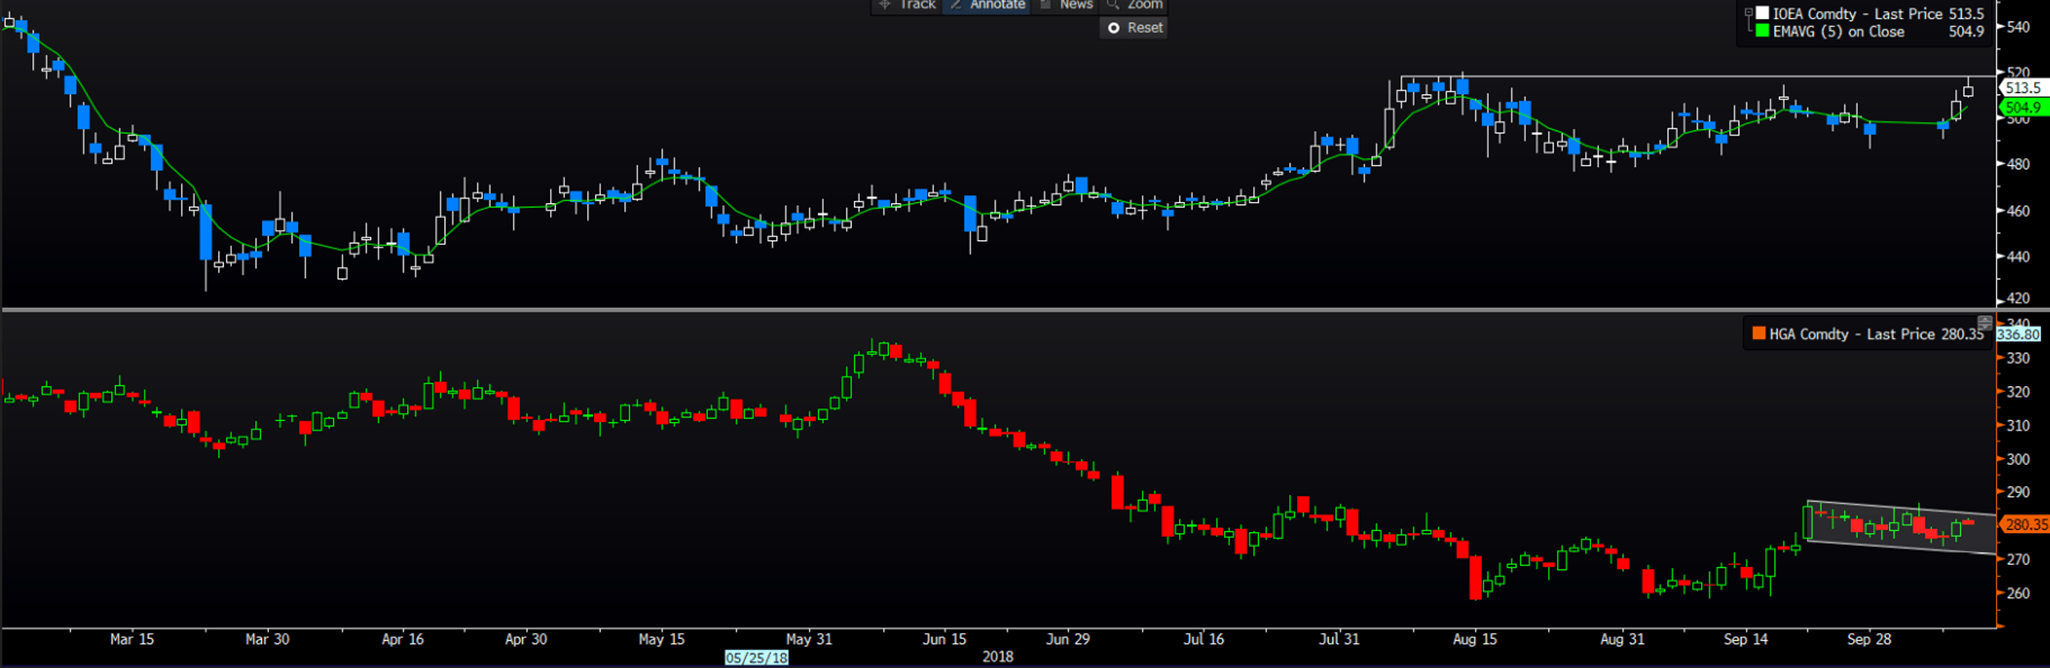
Another consideration is the move in iron ore futures which are testing RMB520, which has been a ceiling on the commodity since August. Copper also looks bullish and is consolidating in what looks like a bull flag, and I would be a buyer on a breakthrough $2.84, and this could be a slight positive for the AUD.
(Iron ore futures - top pane, copper - lower pane)
GBPUSD is also on the radar, with the pairs sitting at session highs and the trend here favours long positions, although with headline risk driving moves, position sizing should be kept to a minimum in my opinion. Traders have been so focused on GBPUSD and EURGBP as a proxy of sentiment towards the Brexit talks, but the set-up on GBPJPY is well worth putting on the radar too. While we may already have a buy signal on cable, GBPJPY is oscillating in a sideways consolidation, where a daily (preferably weekly) close above ¥149.31 would be a strong buy signal, adding on a close through the neckline of the inverse head and shoulders pattern at ¥149.8. On the other side of that, a close below the 21 September (and low of the bearish outside reversal) at ¥146.99 would be a signal to go short.
Sometimes the market can push you into a trade, and in my opinion, this is a set-up that when plays out could define a new strong trend in price.
Author

Chris Weston
Pepperstone
Chris Weston recently joined Pepperstone as Head of Research.


