Is gold now replaying 2010-2012?

The 2019-2021 gold chart is disturbingly similar to that of 2010-2012, but it does not have to be the harbinger of a bear market.
Many ancient cultures saw history as cyclical. According to this view, society passes through repeated cycles. Can this apply to gold as well? I’m not referring here to the simple fact that we have both bull and bear markets in the precious metals –" I refer here to the observation that gold’s price pattern seen in 2019-2021 mirrors that of 2010-2012. Please take a look at the chart below.
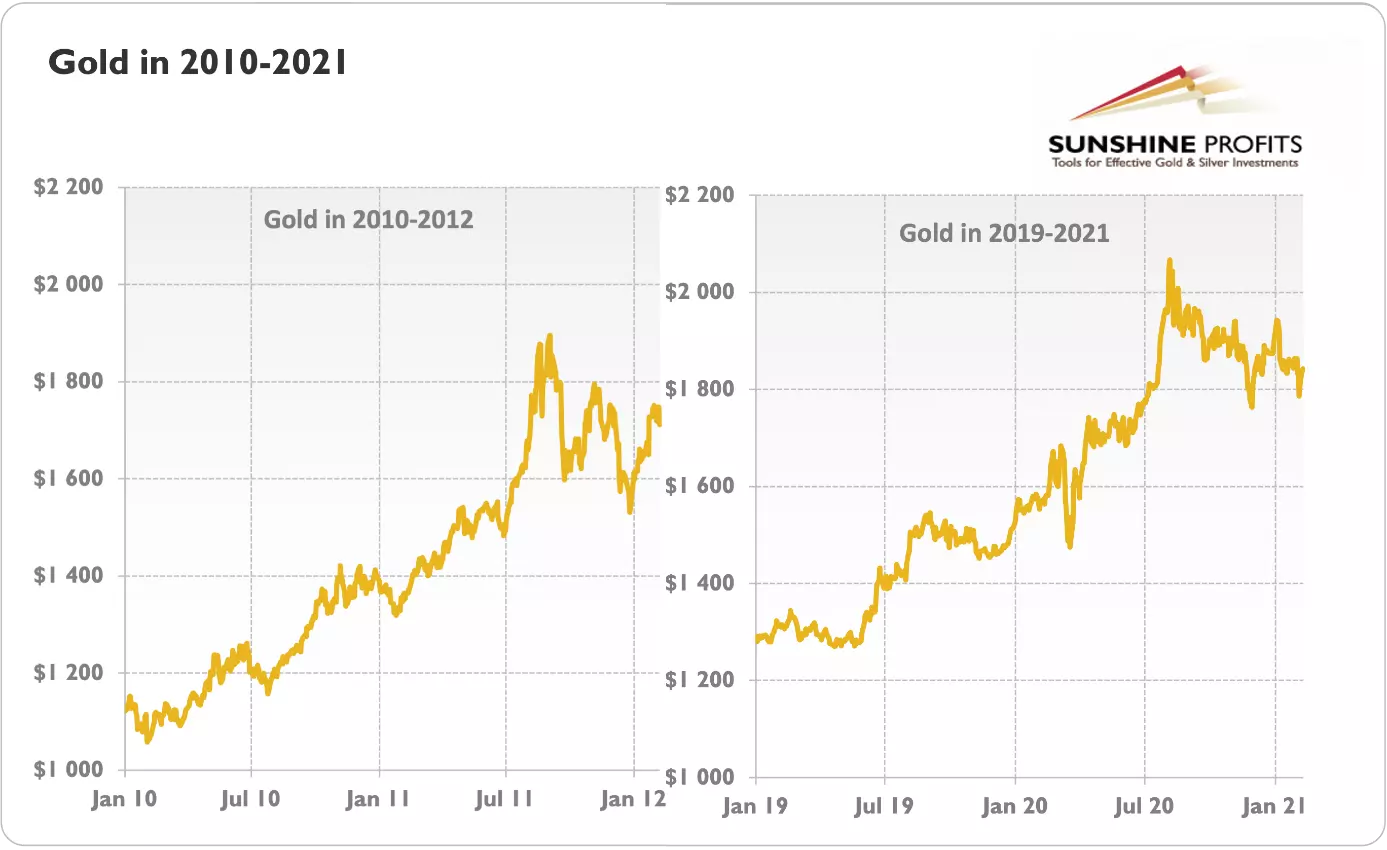
As you can see, in both periods, gold was steadily rising to a peak in the third quarter of the second year. A decade ago, the yellow metal gained 29 percent in 2010 and 74 percent as it hit the top. Then, it declined 19 percent by the end of 2011. Fast forward to more recent times. Gold gained 18.4 percent in 2019 and 62 percent at the peak. Afterwards, it declined 9 percent by the end of 2020.
So, although the magnitude has now been weaker than in the aftermath of the Great Recession, the pattern is quite similar. The next chart –" which presents the normalized gold prices in both periods to indices (when the starting point equals 100) –" nicely illustrates how gold in 2019-2021 closely resembles gold from 2010-2012.
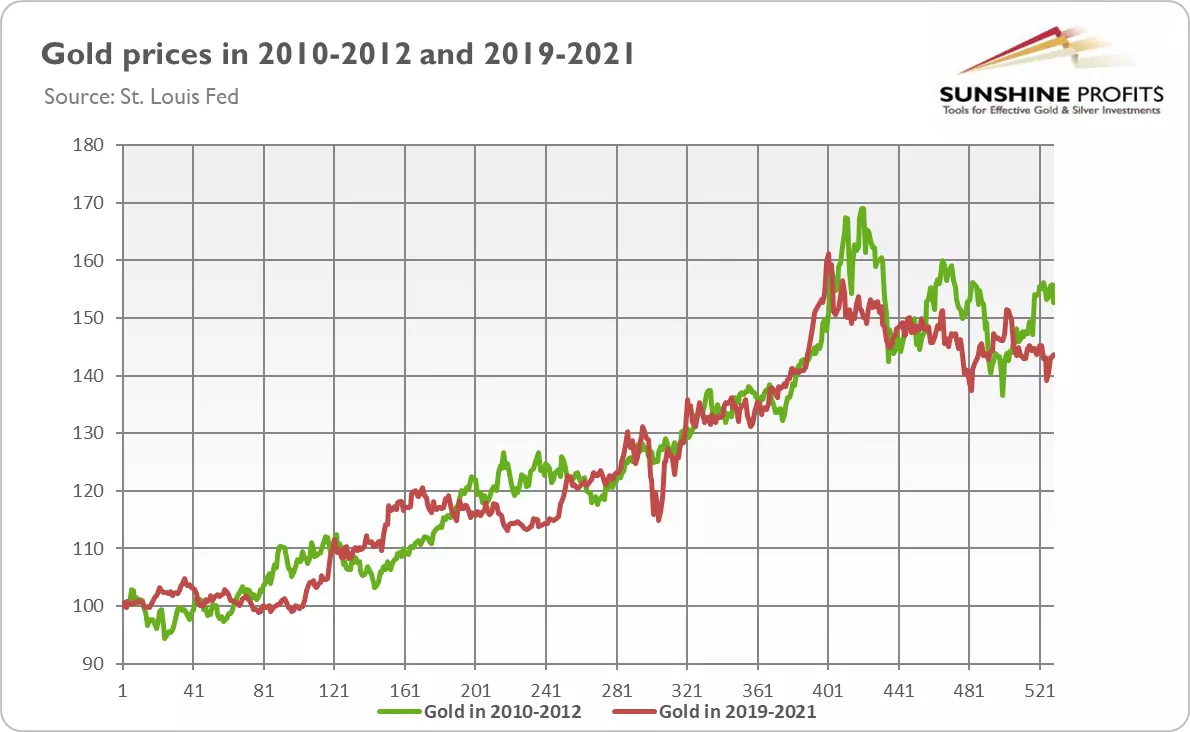
This similarity may be disturbing. Should the pattern hold, then gold could go down significantly and stay in a sideways trend for years. As a reminder, this is what happened a decade ago. Gold bulls fought until the end of 2012, when they gave up and the yellow metal entered a full bear market, plunging 45 percent from the top to the bottom in December 2015. Then, it stayed generally flat till the end of 2018. If this cycle replays, we could see the price of gold go below $1,200 by the end of 2024.
To be clear, there are some arguments to support the bearish case. Just as in the 2010s, the world is recovering now from the global economic crisis. The recession is over and the prospects are only better. Perhaps they’re not rosy, but they’re certainly better than many previously expected, which is what matters for the financial markets. As the worst is behind us, the risk appetite is returning, which could put gold and other safe-haven assets into oblivion. Actually, some could even argue that gold may now plunge even earlier, as a decade ago it was supported by the European sovereign debt crisis , which peaked in 2011-2012.
However, there are also important reasons why gold could break the pattern and diverge from the 2010-2012 trend. First, we now have a much more dovish Fed . The U.S. central bank slashed the federal funds rate much quicker and expanded its balance sheet more decisively. Additionally, to avoid a taper tantrum caused by its announcement about tapering asset purchases, this time the Fed will normalize its monetary policy in a very, very gradual way, if at all. It means that interest rates will stay lower for longer. Lastly, the U.S. central bank changed its monetary policy framework, i.e., it prioritized the labor market over price stability and became more tolerant to higher inflation.
Second, we also have a much easier fiscal policy. Even before the global pandemic, Trump significantly expanded budget deficits, but the Great Lockdown made them even larger. As pundits believe that the fiscal response in the aftermath of the global financial crisis of 2007-2009 was too small, they now want to go big –" indeed, Biden’s $1.9 trillion economic plan is waiting to be passed by Congress.
Third, this recovery might be more inflationary than a decade ago . This is because not only did the monetary base increase, but the broad money supply did as well. Last time, the Fed injected a lot of liquidity to the banking sector to bailout the banks. Now, the money has flowed much more through Main Street and the household sector, which could turn out to be more inflationary when all this money will be spent on goods and services. Also, last time we observed some deleveraging in the private sector, while now the supply of loans is continuously increasing at a positive rate. We are also already observing reflation in the form of a commodity boom, so gold may follow suit.
To sum up, the patterns seen in the gold market in 2010-2012 and 2019-2021 are remarkably similar. So, the recent gold’s weakness may be really disturbing. However, this resemblance does not have to be a harbinger of further problems coming for gold bulls. After all, as Mark Twain is reputed to have said, “history doesn’t repeat itself, but it often rhymes”. Indeed, the macroeconomic and political environment is now clearly different than a decade ago –" it’s more fundamentally positive for the price of gold.
Want free follow-ups to the above article and details not available to 99%+ investors? Sign up to our free newsletter today!
Want free follow-ups to the above article and details not available to 99%+ investors? Sign up to our free newsletter today!
Author

Arkadiusz Sieroń
Gold Price Forecast
Arkadiusz Sieroń received his Ph.D. in economics in 2016 (his doctoral thesis was about Cantillon effects), and has been an assistant professor at the Institute of Economic Sciences at the University of Wrocław since 2017.


