![]()
The UK economy did even better than thought last year, with GDP rising to 3% from an initial estimate of 2.7%. Interestingly, the overall economy managed to do well even though business investment fell by -0.9% (this revised up from an initial reading of -1.4%).
The good news didn’t end there. The UK economy was given a boost by a narrowing of the trade deficit, which narrowed to GBP 6 bn in Q4 from GBP 10.2 bn in Q3. This pushed the current account deficit down to 5.6% of GDP, down from 6.1% of GDP in Q3.
However, there were some weak spots in the report, including:
GDP per head may have increased by 0.5% last quarter and by 2.2% between 2013 and 2014, but this is still 1.2% below levels reached before the financial crisis.
Net disposable income is also 5.1% lower than it was before the financial crisis.
Although the UK’s terms of trade improved last quarter, this belied the UK’s investment position, which deteriorated at the end of 2014. The UK’s income deficit actually widened to GBP 7.6bn in Q4 from GBP 5.3bn in Q3, mostly due to the deficit in general government increasing by GBP 2.3bn in Q4, according to the Office for National Statistics.
GDP per capita is lower now than it was pre the crisis, which goes some way to explain the UK’s productivity crisis. Weakness in worker productivity is one reason why wages have remained so stagnant even though we have seen a tightening in the UK labour market in recent years. This could limit the good news felt by the UK electorate ahead of May’s general election.
From a financial market perspective two things are worrying about the UK economic fundamentals:
1. The weakness in wage growth, which could hurt a consumption-based economy like the UK in the years ahead.
2. The UK’s current account deficit may have improved last quarter, but at 5.6% of GDP it is still very high. This is concerning as we lead up to a potential fractious election in only a few weeks’ time. The UK runs a large deficit that needs to be funded; if the UK’s political situation is perceived as risky then investors could turn away from the UK, which could be bad news for UK assets.
One to watch: FTSE 100 testing the bulls’ determination
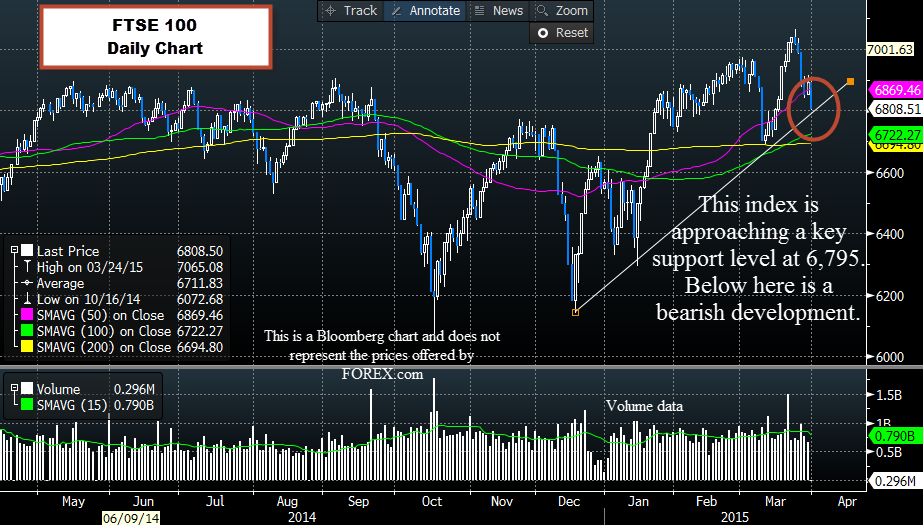
After the best quarter since 2013, the FTSE 100 is faltering at the final hurdle. The FTSE 100 is the weakest performer in the European space so far on Tuesday and has fallen nearly 1.5%. In fairness, the decline in the FTSE 100 started ahead of the UK data release, thus it is unlikely to be a reflection of the weak UK current account position, and instead could be some profit taking ahead of quarter end.
However, this index sliced through the 50-day sma at 6,869 earlier, which is a bearish technical development in the short-term. This index is testing a critical area of support at 6,795. This trend line has supported the FTSE 100 since December 2014. If we fall below this level then we could see back to 6,722 – the 100 day sma, and then 6,600, the lowest level since January.
Takeaway:
The headline UK GDP figures were very strong, GDP grew at a 3% pace last year, the highest level since 2007.
Growth was boosted by an improvement in the UK’s terms of trade.
However, there were some weak spots: The UK’s GDP per capita is still lower than it was before the financial crisis, wages are weaker, and the UK’s investment income deficit widened.
Although the UK’s current account deficit, as a percentage of GDP, improved, it is still high relative to the UK’s peers.
GBP bounced on the back of the data; however the FTSE 100 is coming under pressure as some investors square up positions at quarter end.
The FTSE is approaching a key technical support area; if it falls below this level then we could see a deeper decline.

CFD’s, Options and Forex are leveraged products which can result in losses that exceed your initial deposit. These products may not be suitable for all investors and you should seek independent advice if necessary.
Recommended Content
Editors’ Picks
EUR/USD clings to gains above 1.0750 after US data

EUR/USD manages to hold in positive territory above 1.0750 despite retreating from the fresh multi-week high it set above 1.0800 earlier in the day. The US Dollar struggles to find demand following the weaker-than-expected NFP data.
GBP/USD declines below 1.2550 following NFP-inspired upsurge

GBP/USD struggles to preserve its bullish momentum and trades below 1.2550 in the American session. Earlier in the day, the disappointing April jobs report from the US triggered a USD selloff and allowed the pair to reach multi-week highs above 1.2600.
Gold struggles to hold above $2,300 despite falling US yields

Gold stays on the back foot below $2,300 in the American session on Friday. The benchmark 10-year US Treasury bond yield stays in negative territory below 4.6% after weak US data but the improving risk mood doesn't allow XAU/USD to gain traction.
Bitcoin Weekly Forecast: Should you buy BTC here? Premium

Bitcoin (BTC) price shows signs of a potential reversal but lacks confirmation, which has divided the investor community into two – those who are buying the dips and those who are expecting a further correction.
Week ahead – BoE and RBA decisions headline a calm week

Bank of England meets on Thursday, unlikely to signal rate cuts. Reserve Bank of Australia could maintain a higher-for-longer stance. Elsewhere, Bank of Japan releases summary of opinions.