How high can the gold price rally in march?

To start with the latter, it’s usually not possible to say exactly why a given market is going to move in a certain direction. It can rally based on all sorts of reasons, but all those reasons (news, reports, announcements) are ultimately filtered through the market’s (markets are made of people, after all) emotions.
Here we go again?
Fear and greed are common in the market, and due to them, people tend to follow specific patterns over and over again, regardless of the exact economic surroundings and also pretty much regardless of the time when it’s all taking place. That’s why the market’s performance and analogy from a decade or a few decades ago are still relevant today – because people felt greed and fear just like they do now, and they are likely to react similarly to similar price developments.
This time is no exception. What already happened is likely to happen again – in a slightly different way, but still. Consequently, let’s check which parts of the current environment are similar to previous patterns – and what kind of price action followed them.
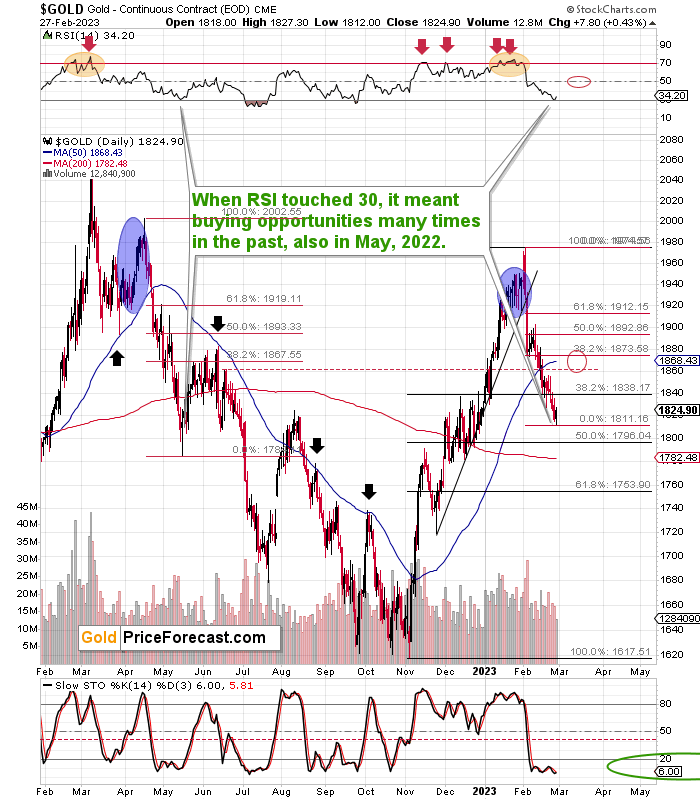
The first thing that is immediately visible (it’s in the upper part of the chart, after all) is the RSI indicator, which just moved to the 30 level and then bounced higher.
This already makes the short-term outlook bullish, because that’s one of the more reliable short-term indicators for gold out there. As you can see, the RSI close to 30 has corresponded to local bottoms many times in the recent past. You don’t see it on the above chart, but it has been the case for many years now. Of course, it’s not a 100% certain signal (there are no certainties on any market), but I found it to be very useful.
Now, what makes the situation particularly interesting – and bullish for the short term – is that the recent downswing (as well as the preceding rally) is similar to what we saw last year in April and May. Back then, gold plunged after a sizable rally, and we see the same thing right now.
If gold declined just like it did in May 2022, then it’s quite possible that the corrective upswing would also be similar. What happened then?
Gold rallied until it moved slightly above the 38.2% Fibonacci retracement and until it touched its 50-day moving average (marked with blue). Back then, the 50-day moving average was above the retracement. This time it’s a bit below it.
Still, those two levels seem to point to a quite coherent target area for the current rally at about $1,870.
We see one more resistance level close to this – the mid-June 2022 high, which I marked with a red dashed line. It’s just above the $1,860 level.
The way down awaits
That’s as far as the price is concerned, but what about the RSI analysis? It’s currently still very close to 30, which leaves gold with some room to rally. Back in mid-2022, the RSI moved close to the middle of its trading range – the 50 level – before gold reversed. And since history tends to rhyme and both periods have been similar so far, one can expect the RSI to move to 50 (approximately) again this time.
Given how big rallies have accompanied big rallies in the RSI, gold at around $1,860 to $1,870 appears to correspond to an RSI close to 50. Consequently, we have yet another confirmation that gold is likely to move to this level before turning south again.
Why would gold and silver want to turn south again? For example, due to soaring real interest rates, which are one of the two primary drivers of gold prices (the other is the USD Index).
What one decides to do with the above target information is up to them. It’s your capital, and it’s your choice what you decide to do with it. In my opinion, the medium-term outlook is so extremely bearish that it makes sense to focus on the “easy part of the rally” and, once it’s over, take profits and perhaps re-enter the short position. As we just profitably closed the short position in the GDXJ, which was the fifth profitable trade in a row, closing the long position would imply a sixth (it’s already profitable, by the way, and the profits increased yesterday). The key thing is that the next short trade is probably going to be a really big and profound one. Based on the historical analogies, it seems that the biggest part of the decline is just ahead (after this corrective upswing).
Consequently, from my point of view, it’s most important not to miss the profits on the upcoming slide – and that’s why my focus here would be to ride and profit on the easy part of the rally only. And that’s why I placed the take-profit in the lower part of the target area that you can see on the above gold chart.
Want free follow-ups to the above article and details not available to 99%+ investors? Sign up to our free newsletter today!
Want free follow-ups to the above article and details not available to 99%+ investors? Sign up to our free newsletter today!
Author

Przemyslaw Radomski, CFA
Gold Price Forecast
Przemyslaw Radomski, CFA (PR) is a precious metals investor and analyst who takes advantage of the emotionality on the markets, and invites you to do the same. His company, Sunshine Profits, publishes analytical software that any


