Believing in Things When Common Sense Tells You Not To

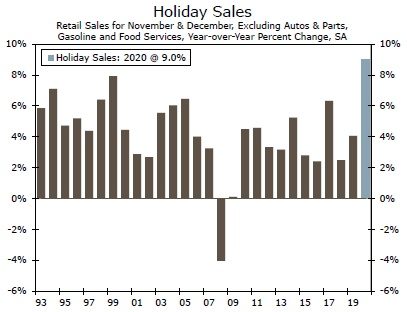
In what undoubtedly will be remembered as one of the most challenging and transformative years for most retailers, we are forecasting holiday sales will increase 9.0% in 2020, which would be the largest increase on record (Figure 1). That is not to say that things are fine for all retailers, (they are not), nor is it to say that consumers are in excellent financial shape (they are not, particularly not toward the lower end of the income spectrum). However, a forced thrift that has curtailed spending in the service sector and cancelled travel plans frees up income for more spending on gifts. After the anxiety and stress of a year defined by the virus, natural disasters and a divisive election, we suspect holiday sales will also benefit from a yearning for comfort and normalcy, which many consumers may associate with having a few more gifts under the tree.

fxsoriginal

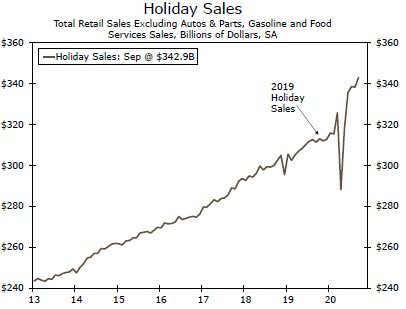
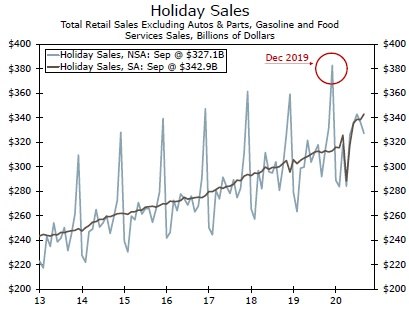
Traditions of the shopping season like the throngs of Black Friday shoppers the day after Thanksgiving, will be largely replaced this year with rolling special sales and "buy-online, pick-up in store" deals while online retailers pile on gains after last year's first-time finish as top overall category of holiday sales. In fact, since Amazon's ‘Prime Day' moved to October, many of its competitors began offering opposing special offers during the month. Some holiday shopping has already been pulled forward so we would not be surprised to see the pace of sales taper off in the traditional holiday spending months of November and December. Even if that is the case, our measure of holiday sales sits comfortably at an all-time high as of September after disruption from the virus earlier this year (Figure 2). The 2020 holiday sales season is on track to be a blowout. But keep this in perspective: this boom in goods spending is coming at the expense of spending on services, which remains depressed. In short, we do not look for overall consumer spending to return to its pre-crisis peak until Q2-2021.

fxsoriginal

Source: U.S. Department of Commerce and Wells Fargo Securities

After all the presents have been opened and all the cardboard shipping boxes have been broken down, we suspect consumers will slow their roll with respect to this goods spending spree. When that happens, retailers could be confronted with a larger-than-usual drop-off in sales in the first quarter. In fact, our forecast has growth in consumer spending slowing in each of the next six quarters as goods spending slows and as spending on services, which has been held back in recent months due to the virus, gradually resumes. With stimulus prospects still up in the air, household income is apt to remain under pressure amid a labor market rebound that has clearly lost momentum.

Every Time a Bell Rings

This has been a year that changed almost everything in the world of retail. The pandemic and the initial shutdowns in March and April shuttered retail operations except for those deemed essential. But, stimulus checks and generous unemployment benefits resulted in an unprecedented surge in income and months of savings that households were (and still are) able to draw upon to fund spending. With spending on many services cut back due to COVID, households had an additional source of funds from a reallocation of wallet share from services to goods.

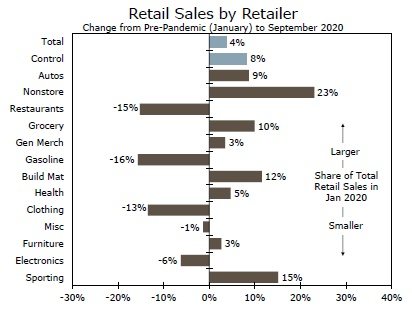
For some retailers, the result was much better than expected. Despite a global pandemic and record numbers of people filing jobless claims, sporting goods stores were back up above their prerecession peak by May and went on to have one of the best summers on record as camp was cancelled and parents picked the shelves clean of bikes, basketball hoops and trampolines. After a 6% monthly increase at sporting goods stores just during the month of September, the category is now up 15% relative to its pre-pandemic level (Figure 3).

fxsoriginal

Source: U.S. Department of Commerce and Wells Fargo Securities

The strong showing of sporting goods stores is only second to e-commerce. Sales for nonstore retailers (online merchants) is 23% above its pre-pandemic peak and now commands a record share of overall retail spending. In our Holiday Sales outlook piece last year we correctly predicted that ecommerce would take the top category for overall holiday sales for the first time. This year we expect it should retain the title belt by a comfortable margin (Figure 4), as consumers increasingly rely on online shopping this holiday season amid the pandemic.

fxsoriginal

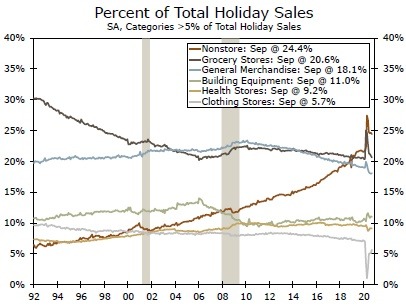
This theme of goods outperforming services helps explain why we have such a strong number for our holiday sales forecast. When looking at our definition of the categories we have long used to define our measure of holiday sales, it is all goods. We define holiday sales as total retail sales, excluding autos & parts, gasoline and food services (restaurant) sales. So while total retail sales are already 3.7% above their pre-virus January level as of September, total holiday sales are a whopping 8.6% above where they stood prior to the virus. We are not cherry picking here as we have long excluded these categories. But as it turns out, these exclusions eliminate some of the worst performing retailers.

People are spending less on gas with the elimination of commuting for many office workers. This is a key explanatory factor for why gasoline station sales are still down 16%, as is lower prices at the pump with average gasoline prices about 16% below where they stood at the start of the year. Restaurant sales have been clawing back lost business for months. But even after five consecutive monthly increases, restaurant sales are still 15% lower than where they were before the pandemic as capacity constraints continue to limit the rebound. On the other hand, we also exclude autos & parts, which has done rather well this year, up 9% ahead of its pre-virus level as of September. Even if our overall measure of holiday sales remains flat on a seasonally adjusted basis from October to December, it would still be up 9.8% relative to last year (reference back to Figure 2 on page 1).

If I Woke Up with My Head Sewn to the Carpet, I Wouldn't Be More Surprised

Like a lot of things in 2020, dialing in a precise estimate for holiday sales this year is more difficult than usual. COVID has caused large swings in retail sales in recent months and it is unclear if the typical November and December surge will materialize in a year when some demand may have been pulled forward. The National Retail Federation described it perfectly comparing the task of forecasting holiday sales this year to completing a jigsaw puzzle without all the pieces.1

After approaching our forecast a few different ways, we are looking for holiday sales, or sales in November and December, to rise about 9% over last year, the highest on record. A record increase in the midst of a pandemic is hardly the most intuitive outcome, but consider that our measure of holiday sales already sits comfortably above the level of sales reached last year. In order to get anything short of a well-above-average increase you would need to assume massive declines in the remaining months of the year; declines in the ballpark of what we saw during April lockdowns. In fact, even if you take the worst monthly declines on record going back to 1992 for October (-1.6%), November (-1.4%) and December (-3.1%), and use those as placeholders for the next three months, holiday sales would still come in a strong +4.9% this year.

After framing out thinking by looking at the worst monthly declines as a first pass, we arrived at our 9% figure by conducting a bottoms-up approach looking at the 10 types of retailers included in our holiday sales measure.2 Based on buying patterns we have seen throughout the pandemic and what we are expecting regarding certain types of stores, we plugged in our expected forecast per retailer category to arrive at our final figure of 9%.

Remarkably, we are not even penciling in a banner year in terms of month-over-month growth rates. Our 9% forecast looks for monthly changes over the next three months that are below what we typically see historically. Perhaps the best way to put it is that our forecast of a 9% year-over-year increase requires a 2% decline in seasonally adjusted sales through the end of the year from where we are as of September.

A record increase in holiday sales is a lot to process. We have also considered a more pessimistic forecast, which has holiday sales still up at a solid 6.9% versus last year. In this forecast, we again utilized our bottoms up approach, but assumed that sales are pulled extensively into October and November and then fall off a cliff in December. This forecast requires a nearly 5% decline in sales through the end of the year from where we are as of September. Although, this is not our base case scenario, it presents a reasonable outcome, in our view. We will update the numbers as the data come in over the next few months. Even if we get a blowout October, however, we would not revise our forecast higher because of this concern about demand being pulled forward.

Seasonals' Greetings!

The biggest factor giving us pause with respect to our forecast is the seasonal adjustment process. To fully understand what it actually means to be unchanged on a seasonally adjusted (SA) basis, it is useful to offer a very high-level recap of this adjustment process itself. Seasonal adjustment is used in economics whenever you have a data series that is subject to regular and predictable (often annual) disruption or volatility that you are trying to mute statistically so that the underlying cyclical trend becomes more visible. Classic examples include summer shutdowns to retool plants which disrupt auto production figures, or farm output and crop yields which vary by month and season, and of course retail sales figures, which get a big bump in November and particularly in December due to the holidays.

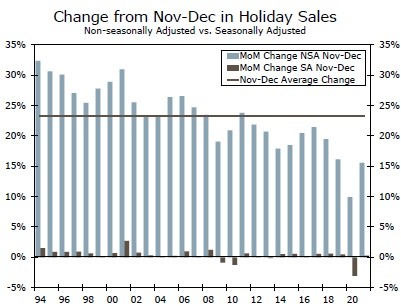
In a typical December, non-seasonally adjusted (NSA) holiday sales rise about 23% relative to the previous month. A gain of something smaller than that would likely come out as a decline in the seasonally adjusted (SA) figures. In each of the past two years, we have gotten bit by this dynamic. In 2019, holiday sales increased 5.8% (NSA) in November, but because that was smaller than a typical November increase of 6.7%, the SA change was a small monthly decline (-0.3%). December 2018 was an even worse example—NSA holiday sales rose 9.9% in December, but because a typical December increase would be well into the double digits, the SA number was a 3.1% monthly decline (Figure 5).

fxsoriginal

Source: U.S. Department of Commerce and Wells Fargo Securities

This is where that dynamic of sales being pulled forward into earlier months becomes very important to the outlook for the final months of the year. Consider, for example, if the combination of Prime Day and adjacent competing sales at other major retailers results in October bringing forward sales that might otherwise have been recorded in the traditional holiday shopping season (November and December). Then, we might reasonably expect smaller gains in November or December, which could even result in outright declines on a SA basis. Figure 6 demonstrates the key difference in the SA and NSA measure of holiday sales this season. Although NSA sales remain significantly below their December 2019 level, which is typical if you observe the variation leading to the typical pop in November and December, the SA measure is already considerably above where it stood last holiday season through September (+9.6%).

fxsoriginal

Outlook: Giddy-Up Jingle

Horse Once the holidays are over, retailers might be due for a patch of softer spending from consumers. We do not expect the absence of stimulus to result in sales cratering thanks to the shored up savings that households have squirreled away. But, that savings might be parsed out slowly if the job market does not pick-up soon.

At the bottom end of the income and wealth spectrum, spending could decline sharply. These are the households that disproportionately were impacted by layoffs earlier this year and thus were the greatest beneficiaries of generous unemployment benefits. The absence of those top-up checks are keenly felt by these households. We recently wrote about the degree to which households can tap rising wealth, but according to Census data median income for the bottom 40% of households is below $35K/year and most of that is tied up in the value of automobiles and other durable goods which are not easily converted into cash. For now though, the consumer sector that has been the primary driver for the economy in 2020 has one more trick up its sleeve with a record increase in holiday sales.

Download The Full Special Commentary

Recently, the stock market has experienced high levels of volatility. If you are thinking about participating in fast moving markets, please take the time to read the information below. Wells Fargo Investments, LLC will not be restricting trading on fast moving securities, but you should understand that there can be significant additional risks to trading in a fast market. We've tried to outline the issues so you can better understand the potential risks. If you're unsure about the risks of a fast market and how they may affect a particular trade you've considering, you may want to place your trade through a phone agent at 1-800-TRADERS. The agent can explain the difference between market and limit orders and answer any questions you may have about trading in volatile markets. Higher Margin Maintenance Requirements on Volatile Issues The wide swings in intra-day trading have also necessitated higher margin maintenance requirements for certain stocks, specifically Internet, e-commerce and high-tech issues. Due to their high volatility, some of these stocks will have an initial and a maintenance requirement of up to 70%. Stocks are added to this list daily based on market conditions. Please call 1-800-TRADERS to check whether a particular stock has a higher margin maintenance requirement. Please note: this higher margin requirement applies to both new purchases and current holdings. A change in the margin requirement for a current holding may result in a margin maintenance call on your account. Fast Markets A fast market is characterized by heavy trading and highly volatile prices. These markets are often the result of an imbalance of trade orders, for example: all "buys" and no "sells." Many kinds of events can trigger a fast market, for example a highly anticipated Initial Public Offering (IPO), an important company news announcement or an analyst recommendation. Remember, fast market conditions can affect your trades regardless of whether they are placed with an agent, over the internet or on a touch tone telephone system. In Fast Markets service response and account access times may vary due to market conditions, systems performance, and other factors. Potential Risks in a Fast Market "Real-time" Price Quotes May Not be Accurate Prices and trades move so quickly in a fast market that there can be significant price differences between the quotes you receive one moment and the next. Even "real-time quotes" can be far behind what is currently happening in the market. The size of a quote, meaning the number of shares available at a particular price, may change just as quickly. A real-time quote for a fast moving stock may be more indicative of what has already occurred in the market rather than the price you will receive. Your Execution Price and Orders Ahead In a fast market, orders are submitted to market makers and specialists at such a rapid pace, that a backlog builds up which can create significant delays. Market makers may execute orders manually or reduce size guarantees during periods of volatility. When you place a market order, your order is executed on a first-come first-serve basis. This means if there are orders ahead of yours, those orders will be executed first. The execution of orders ahead of yours can significantly affect your execution price. Your submitted market order cannot be changed or cancelled once the stock begins trading. Initial Public Offerings may be Volatile IPOs for some internet, e-commerce and high tech issues may be particularly volatile as they begin to trade in the secondary market. Customers should be aware that market orders for these new public companies are executed at the current market price, not the initial offering price. Market orders are executed fully and promptly, without regard to price and in a fast market this may result in an execution significantly different from the current price quoted for that security. Using a limit order can limit your risk of receiving an unexpected execution price. Large Orders in Fast Markets Large orders are often filled in smaller blocks. An order for 10,000 shares will sometimes be executed in two blocks of 5,000 shares each. In a fast market, when you place an order for 10,000 shares and the real-time market quote indicates there are 15,000 shares at 5, you would expect your order to execute at 5. In a fast market, with a backlog of orders, a real-time quote may not reflect the state of the market at the time your order is received by the market maker or specialist. Once the order is received, it is executed at the best prices available, depending on how many shares are offered at each price. Volatile markets may cause the market maker to reduce the size of guarantees. This could result in your large order being filled in unexpected smaller blocks and at significantly different prices. For example: an order for 10,000 shares could be filled as 2,500 shares at 5 and 7,500 shares at 10, even though you received a real-time quote indicating that 15,000 shares were available at 5. In this example, the market moved significantly from the time the "real-time" market quote was received and when the order was submitted. Online Trading and Duplicate Orders Because fast markets can cause significant delays in the execution of a trade, you may be tempted to cancel and resubmit your order. Please consider these delays before canceling or changing your market order, and then resubmitting it. There is a chance that your order may have already been executed, but due to delays at the exchange, not yet reported. When you cancel or change and then resubmit a market order in a fast market, you run the risk of having duplicate orders executed. Limit Orders Can Limit Risk A limit order establishes a "buy price" at the maximum you're willing to pay, or a "sell price" at the lowest you are willing to receive. Placing limit orders instead of market orders can reduce your risk of receiving an unexpected execution price. A limit order does not guarantee your order will be executed -" however, it does guarantee you will not pay a higher price than you expected. Telephone and Online Access During Volatile Markets During times of high market volatility, customers may experience delays with the Wells Fargo Online Brokerage web site or longer wait times when calling 1-800-TRADERS. It is possible that losses may be suffered due to difficulty in accessing accounts due to high internet traffic or extended wait times to speak to a telephone agent. Freeriding is Prohibited Freeriding is when you buy a security low and sell it high, during the same trading day, but use the proceeds of its sale to pay for the original purchase of the security. There is no prohibition against day trading, however you must avoid freeriding. To avoid freeriding, the funds for the original purchase of the security must come from a source other than the sale of the security. Freeriding violates Regulation T of the Federal Reserve Board concerning the extension of credit by the broker-dealer (Wells Fargo Investments, LLC) to its customers. The penalty requires that the customer's account be frozen for 90 days. Stop and Stop Limit Orders A stop is an order that becomes a market order once the security has traded through the stop price chosen. You are guaranteed to get an execution. For example, you place an order to buy at a stop of $50 which is above the current price of $45. If the price of the stock moves to or above the $50 stop price, the order becomes a market order and will execute at the current market price. Your trade will be executed above, below or at the $50 stop price. In a fast market, the execution price could be drastically different than the stop price. A "sell stop" is very similar. You own a stock with a current market price of $70 a share. You place a sell stop at $67. If the stock drops to $67 or less, the trade becomes a market order and your trade will be executed above, below or at the $67 stop price. In a fast market, the execution price could be drastically different than the stop price. A stop limit has two major differences from a stop order. With a stop limit, you are not guaranteed to get an execution. If you do get an execution on your trade, you are guaranteed to get your limit price or better. For example, you place an order to sell stock you own at a stop limit of $67. If the stock drops to $67 or less, the trade becomes a limit order and your trade will only be executed at $67 or better. Glossary All or None (AON) A stipulation of a buy or sell order which instructs the broker to either fill the whole order or don't fill it at all; but in the latter case, don't cancel it, as the broker would if the order were filled or killed. Day Order A buy or sell order that automatically expires if it is not executed during that trading session. Fill or Kill An order placed that must immediately be filled in its entirety or, if this is not possible, totally canceled. Good Til Canceled (GTC) An order to buy or sell which remains in effect until it is either executed or canceled (WellsTrade® accounts have set a limit of 60 days, after which we will automatically cancel the order). Immediate or Cancel An order condition that requires all or part of an order to be executed immediately. The part of the order that cannot be executed immediately is canceled. Limit Order An order to buy or sell a stated quantity of a security at a specified price or at a better price (higher for sales or lower for purchases). Maintenance Call A call from a broker demanding the deposit of cash or marginable securities to satisfy Regulation T requirements and/or the House Maintenance Requirement. This may happen when the customer's margin account balance falls below the minimum requirements due to market fluctuations or other activity. Margin Requirement Minimum amount that a client must deposit in the form of cash or eligible securities in a margin account as spelled out in Regulation T of the Federal Reserve Board. Reg. T requires a minimum of $2,000 or 50% of the purchase price of eligible securities bought on margin or 50% of the proceeds of short sales. Market Makers NASD member firms that buy and sell NASDAQ securities, at prices they display in NASDAQ, for their own account. There are currently over 500 firms that act as NASDAQ Market Makers. One of the major differences between the NASDAQ Stock Market and other major markets in the U.S. is NASDAQ's structure of competing Market Makers. Each Market Maker competes for customer order flow by displaying buy and sell quotations for a guaranteed number of shares. Once an order is received, the Market Maker will immediately purchase for or sell from its own inventory, or seek the other side of the trade until it is executed, often in a matter of seconds. Market Order An order to buy or sell a stated amount of a security at the best price available at the time the order is received in the trading marketplace. Specialists Specialist firms are those securities firms which hold seats on national securities exchanges and are charged with maintaining orderly markets in the securities in which they have exclusive franchises. They buy securities from investors who want to sell and sell when investors want to buy. Stop An order that becomes a market order once the security has traded through the designated stop price. Buy stops are entered above the current ask price. If the price moves to or above the stop price, the order becomes a market order and will be executed at the current market price. This price may be higher or lower than the stop price. Sell stops are entered below the current market price. If the price moves to or below the stop price, the order becomes a market order and will be executed at the current market price. Stop Limit An order that becomes a limit order once the security trades at the designated stop price. A stop limit order instructs a broker to buy or sell at a specific price or better, but only after a given stop price has been reached or passed. It is a combination of a stop order and a limit order. These articles are for information and education purposes only. You will need to evaluate the merits and risks associated with relying on any information provided. Although this article may provide information relating to approaches to investing or types of securities and investments you might buy or sell, Wells Fargo and its affiliates are not providing investment recommendations, advice, or endorsements. Data have been obtained from what are considered to be reliable sources; however, their accuracy, completeness, or reliability cannot be guaranteed. Wells Fargo makes no warranties and bears no liability for your use of this information. The information made available to you is not intended, and should not be construed as legal, tax, or investment advice, or a legal opinion.

Recommended Content


Recommended Content

Editors’ Picks

USD/JPY jumps above 156.00 on BoJ's steady policy

USD/JPY jumps above 156.00 on BoJ's steady policy

USD/JPY has come under intense buying pressure, surging past 156.00 after the Bank of Japan kept the key rate unchanged but tweaked its policy statement. The BoJ maintained its fiscal year 2024 and 2025 core inflation forecasts, disappointing the Japanese Yen buyers. 

USD/JPY News

AUD/USD consolidates gains above 0.6500 after Australian PPI data

AUD/USD consolidates gains above 0.6500 after Australian PPI data

AUD/USD is consolidating gains above 0.6500 in Asian trading on Friday. The pair capitalizes on an annual increase in Australian PPI data. Meanwhile, a softer US Dollar and improving market mood also underpin the Aussie ahead of the US PCE inflation data. 

AUD/USD News

Gold price flatlines as traders look to US PCE Price Index for some meaningful impetus

Gold price flatlines as traders look to US PCE Price Index for some meaningful impetus

Gold price lacks any firm intraday direction and is influenced by a combination of diverging forces. The weaker US GDP print and a rise in US inflation benefit the metal amid subdued USD demand. Hawkish Fed expectations cap the upside as traders await the release of the US PCE Price Index.

Gold News

Stripe looks to bring back crypto payments as stablecoin market cap hits all-time high

Stripe looks to bring back crypto payments as stablecoin market cap hits all-time high

Stripe announced on Thursday that it would add support for USDC stablecoin, as the stablecoin market exploded in March, according to reports by Cryptocompare.

Read more

US economy: Slower growth with stronger inflation

US economy: Slower growth with stronger inflation

The US Dollar strengthened, and stocks fell after statistical data from the US. The focus was on the preliminary estimate of GDP for the first quarter. Annualised quarterly growth came in at just 1.6%, down from the 2.5% and 3.4% previously forecast.

Read more

Majors

Cryptocurrencies

Signatures