Hang Seng Index Technical analysis – Will the HK50 price rebound continue?
Hang Seng Index technical analysis summary
Sell Stop: Below 24415.9.
Stop Loss: Above 25734.3.
| Indicator | Signal |
| RSI | Neutral |
| MACD | Sell |
| Donchian Channel | Sell |
| MA(200) | Sell |
| Fractals | Neutral |
| Parabolic SAR | Sell |
Hang Seng Index chart analysis
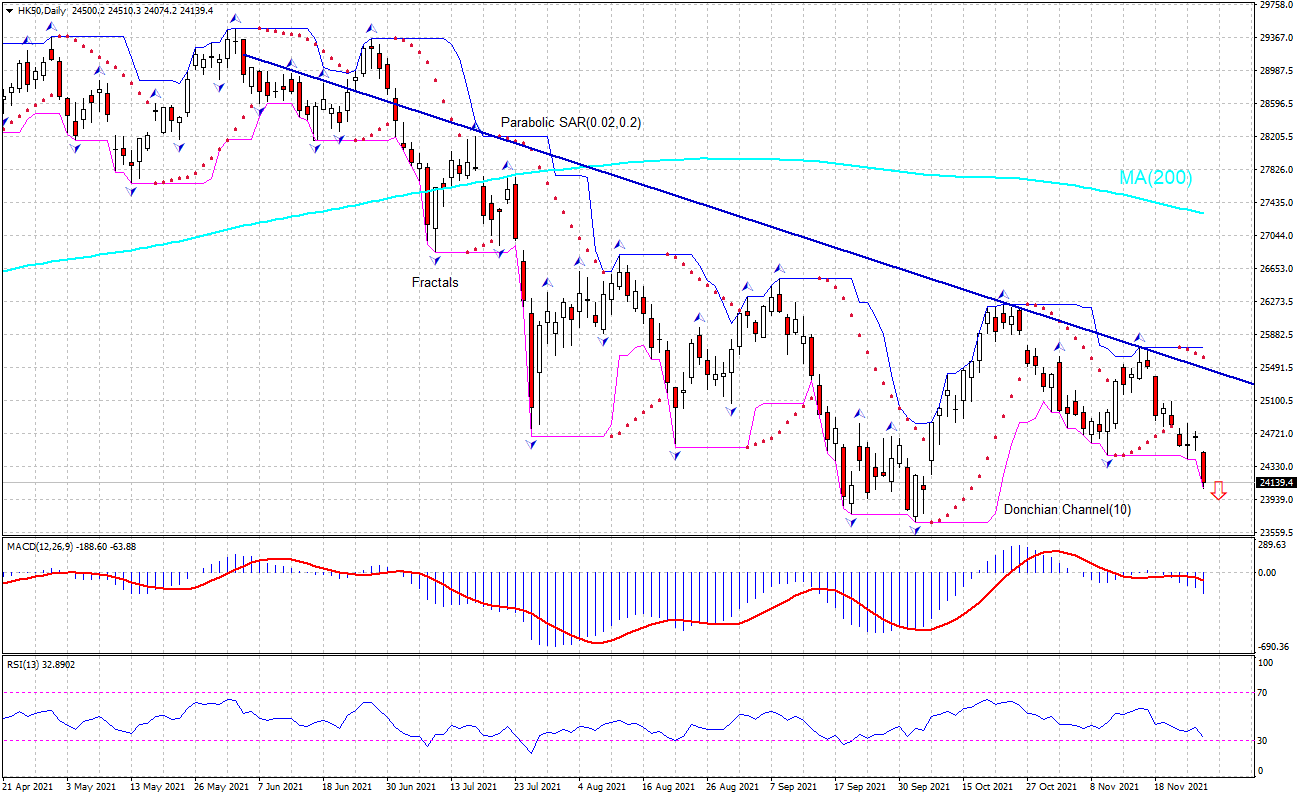
The technical analysis of the HK50 price chart in daily timeframe shows HK50: Daily is retracing after failed attempt to breach the resistance line below the 200-day moving average MA(200). We believe the bearish momentum will continue after the price breaches below the lower Donchian boundary at 24415.9. This level can be used as an entry point for placing a pending order to sell. The stop loss can be placed above the upper Donchian boundary at 25734.3. After placing the pending order the stop loss is to be moved every day to the next fractal high indicator, following Parabolic signals. Thus, we are changing the expected profit/loss ratio to the breakeven point. If the price meets the stop-loss level (25734.3) without reaching the order (24415.9) we recommend cancelling the order: the market sustains internal changes which were not taken into account.
Fundamental analysis of indices – Hang Seng Index
Hong Kong private sector activity expansion slowed in October. Will the HK50 price rebound continue?
Recent Hong Kong economic data in the last couple of weeks were mixed. Trade deficit narrowed in October while retail sales growth slowed in September, and Hong Kong private sector activity expansion slowed in October. Thus, trade deficit declined to H$30.5 billion from H$42.4 billion in September. But retail sales grew 4.7% over year in September after 10% increase in August. And Markit reported Hong Kong PMI declined to 50.8 in October from 51.7 a month earlier. Readings above 50 indicate sector activity expansion. Both demand and output rose for the ninth straight month, but rates of growth softened from September. Meantime, foreign demand fell, including new business from China. Slowing business activity is bearish for HK50.
Want to get more free analytics? Open Demo Account now to get daily news and analytical materials.
Want to get more free analytics? Open Demo Account now to get daily news and analytical materials.
Author

Dmitry Lukashov
IFC Markets
Dimtry Lukashov is the senior analyst of IFC Markets. He started his professional career in the financial market as a trader interested in stocks and obligations.


