Gold’s persistent bullish phases mark a century of growth

Gold has long been revered for its aesthetic allure and as a hedge against economic uncertainties. Recently, the gold market started to correct lower. This is due to seasonal adjustments and an overbought condition noted in weekly and daily charts. Despite this temporary pullback, the price trajectory of precious metals remains steadily upward, with analysis eyeing an initial target of $3,000. This target is the first target of this gold bullish phase which was initiated in 2019.
Gold bullish phases
Understanding gold’s behavior over the past two decades provides insightful context into its current movements and potential future. The 21st century has seen gold’s value progress through two major bullish phases. The first started in 2001 when prices were as low as $255.80. Over the next ten years, gold experienced a remarkable rally, peaking in 2011 at $1,923.70. This peak concluded a decade of gains but led into a four-year corrective phase, which found a bottom at $1,045.40. The chart below explains the two phases of gold market in the 21st century.
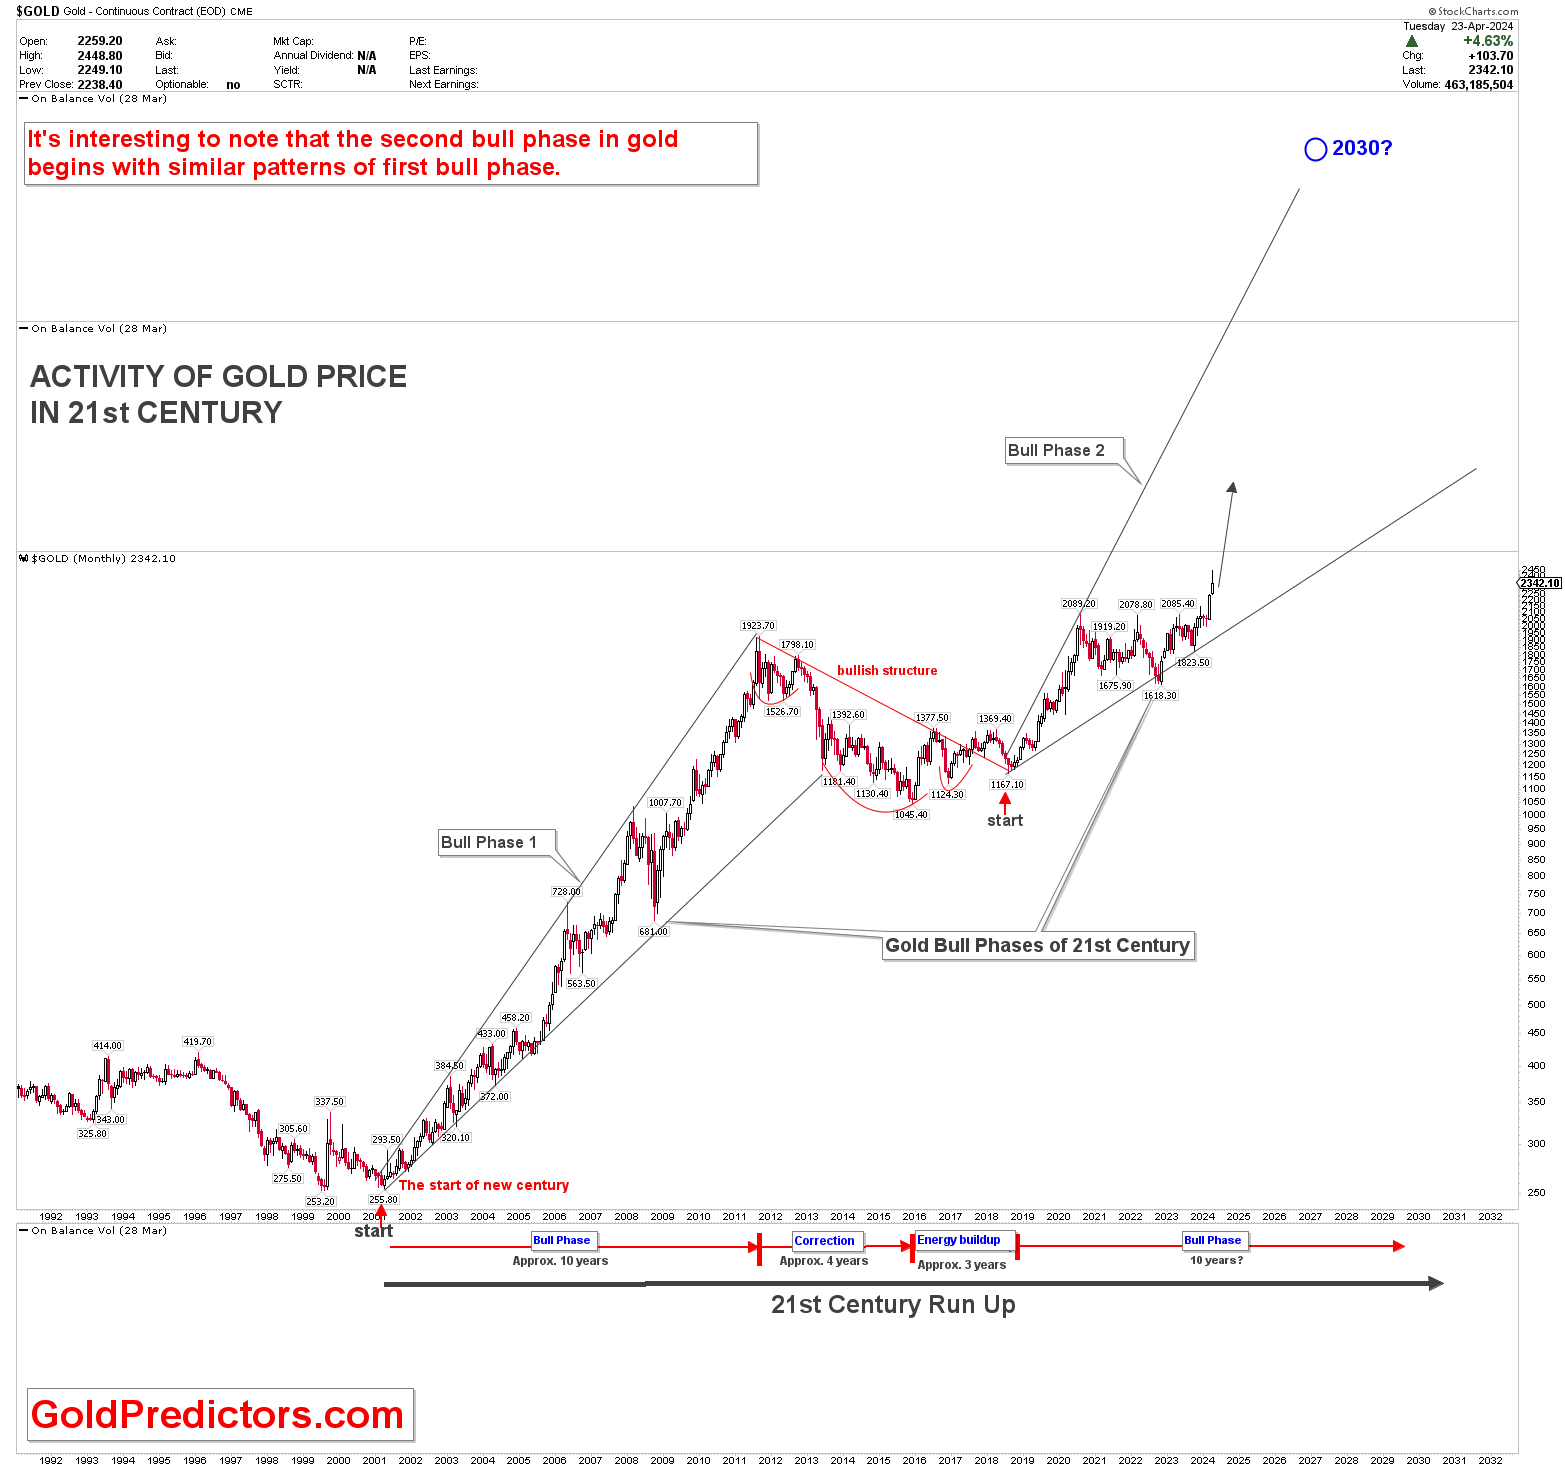
This low marked a significant turning point as gold built momentum in the following three years. During this period, the market laid the groundwork for recovery, forming an inverted head-and-shoulders pattern. These patterns are classic bullish indicator in technical analysis. This pattern completion kicked off another bullish phase of price increases starting in 2019. This indicates the similarity in the pattern seen from the bottom of 2001.
Both bullish phases exhibited an ascending broadening wedge formation, suggesting substantial market volatility. This pattern is typically associated with increasing uncertainty and more significant price swings, which seems to align with the current economic backdrop marked by significant inflation rates.
The recent breakout above the yearly pivot of $2,075 confirmed the market’s ongoing strength, setting the stage for continued upward movement. Even as the market undergoes a correction, particularly noted in April 2024, the strong momentum is expected to carry higher prices through the remainder of the year. This suggests that the present correction phase may consolidate in the short term and highlight the strong bottom within the next few weeks and a strong rally ahead.
Conclusion
This correction within the strong upward long-term trend indicates a strategic buying opportunity for investors. The gold market’s historical price pattern and the pattern’s similarity from the first bullish phase indicate a strong rally in the gold market in the coming years. Moreover, the technical outlook with the broadening wedge pattern amid strong inflation suggests that gold prices might experience growth. Investors keen on leveraging gold’s historically proven stability and potential for significant gains should consider entering the market during these correction phases. This strategy could maximize returns when the market rebounds.
In conclusion, gold continues to exhibit a strong market presence with promising prospects. Gold’s appeal as a safe-haven asset, solid technical indicators, and geopolitical tensions suggest that gold will continue to be a valuable component of investment strategies focused on protection and growth. As we move into 2024, the gold market will likely continue to shine with excellent buying opportunities ahead.
Unlock exclusive gold and silver trading signals and updates that most investors don’t see. Join our free newsletter now!
Author

Muhammad Umair, PhD
Gold Predictors
Muhammad Umair is a financial markets analyst and investor who focuses on the forex and precious metals markets.


