Gold Weekly Forecast: US inflation data could trigger next big action
- Gold regained its traction after dropping below $2,500 earlier in the week.
- The near-term technical outlook suggests that sellers remain on the sidelines.
- August Consumer Price Index (CPI) data from the US stand out in next week’s calendar.

After staying under modest bearish pressure in the first half of the week, Gold (XAU/USD) benefited from falling US Treasury bond yields and reclaimed $2,500. August inflation data from the US could fuel the next directional move in the precious metal.
Gold buyers continue to defend $2,500
Gold spent the first day of the week fluctuating in a tight range as trading conditions thinned out with the US financial markets remaining closed in observance of the Labor Day Holiday.
Wall Street’s main indexes declined sharply following the three-day weekend on Tuesday, allowing the US Dollar (USD) to gather strength and causing XAU/USD to drop below $2,500. On Wednesday, the USD came under selling pressure after the data published by the US Bureau of Labor Statistics (BLS) showed that the number of job openings on the last business day of July stood at 7.67 million, down from 7.9 million in June and below the market expectation of 8.1 million.
As Gold recovered back above the key $2,500 level early Thursday, technical sellers took action and helped the yellow metal extend its recovery. In the American session, the Automatic Data Processing (ADP) reported that employment in the private sector rose by 99,000 in August. This reading followed the 111,000 (revised from 122,000) increase recorded in July and missed the market expectation of 145,000 by a wide margin. The benchmark 10-year US Treasury bond yield dropped toward 3.7% and paved the way for another leg higher in XAU/USD.
On Friday, the BLS announced that Nonfarm Payrolls rose by 142,000 in August, falling short of the market forecast of 160,000. Additionally, July’s increase of 114,000 was revised down to 89,000. Other details of the jobs report showed that the Unemployment Rate edged lower to 4.2%, as expected. As the 10-year US extended its weekly decline and slumped below 3.7% after these readings, Gold held its ground heading into the weekend.
Gold investors await US inflation data
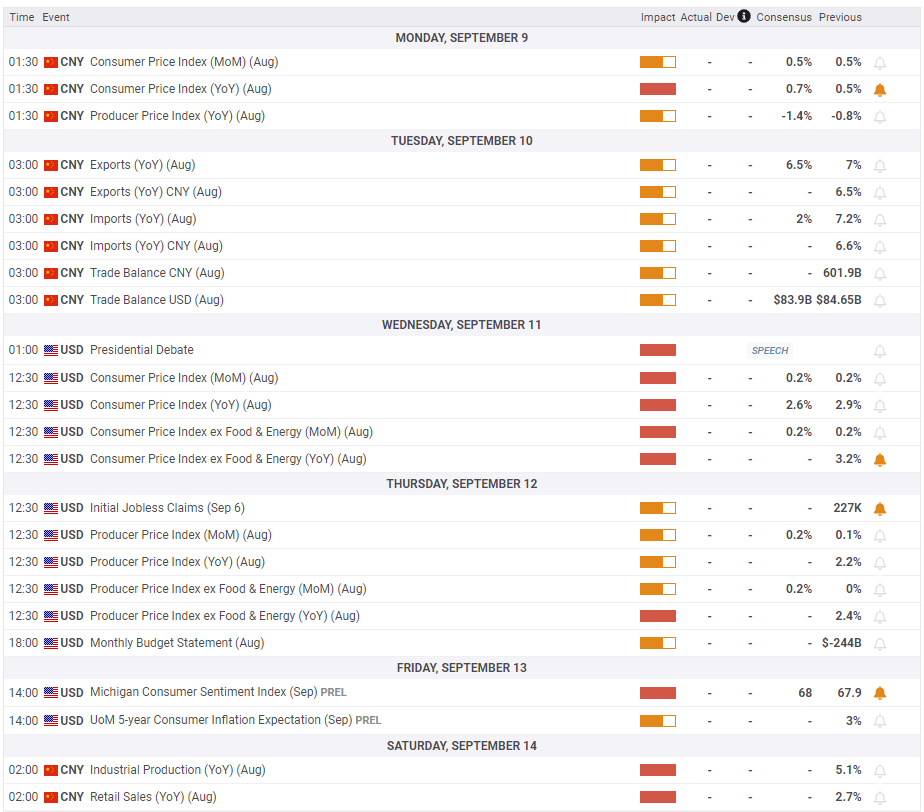
Trade Balance data from China could trigger a reaction in Gold during the Asian trading hours on Tuesday. In case China’s trade surplus widens noticeably in August, the immediate reaction could help Gold stretch higher because China is the world’s biggest consumer of Gold. On the flip side, investors could grow concerned about Gold’s demand outlook and cause the price to turn south in the near term if the trade surplus shrinks.
On Wednesday, August Consumer Price Index (CPI) data from the US will be watched closely by market participants. On a monthly basis, the CPI and the core CPI, which excludes volatile food and energy prices, are both forecast to rise 0.2%. In case the core CPI increases by 0.4% or more, US Treasury bond yields could rebound and cause Gold to lose its footing. On the flip side, a reading at or below the market forecast could make it difficult for the USD to attract investors and help XAU/USD push higher.
On Thursday, the European Central Bank (ECB) will announce monetary policy decisions. Although this event is unlikely to have a direct impact on Gold’s valuation, it could influence the USD’s valuation. A dovish ECB surprise could allow the USD to capture capital outflows out of the Euro and limit XAU/USD’s upside.
Assessing the current market positioning in Gold, “our read on positioning dynamics is now already at extreme levels that have historically marked significant turning points in Gold markets,” TD Securities Senior Commodity Strategist Daniel Ghali said in a report. “Macro fund positioning is now at levels only seen during the Brexit referendum in 2016, the ‘stealth QE’ narrative in 2019, or in the peak panic of the Covid-19 crisis in March 2020. This time around, physical markets have already fizzled out, whereas we also see extremes in Shanghai trader positions alongside CTA trend followers. Downside risks are more potent,” Ghali added.
Gold technical outlook
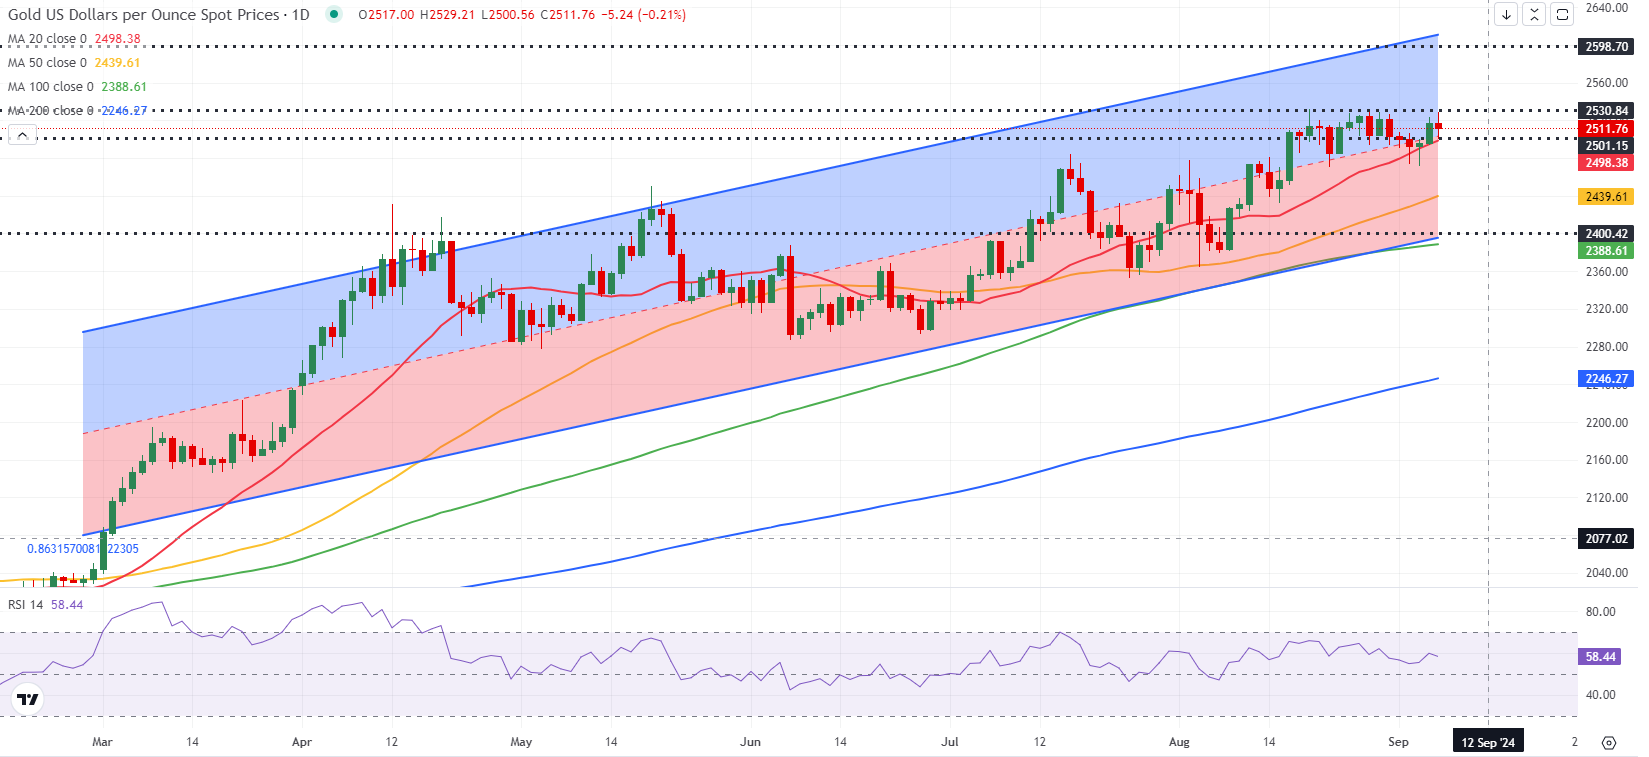
The bullish bias remains unchanged in the near term, with the Relative Strength Index (RSI) indicator on the daily chart holding near 60 and Gold trading within the upper half of the ascending regression channel coming from early March.
Immediate support is located at $2,500 (20-day Simple Moving Average (SMA), mid-point of the ascending regression channel). If Gold falls below this level and confirms it as resistance, $2,440 (50-day SMA) could be seen as the next support before $2,400 (lower limit of the ascending channel.
On the upside, the first resistance is located at $2,530 (static level). Once Gold clears this hurdle, it could target the upper limit of the ascending channel at $2,600.
Gold FAQs
Gold has played a key role in human’s history as it has been widely used as a store of value and medium of exchange. Currently, apart from its shine and usage for jewelry, the precious metal is widely seen as a safe-haven asset, meaning that it is considered a good investment during turbulent times. Gold is also widely seen as a hedge against inflation and against depreciating currencies as it doesn’t rely on any specific issuer or government.
Central banks are the biggest Gold holders. In their aim to support their currencies in turbulent times, central banks tend to diversify their reserves and buy Gold to improve the perceived strength of the economy and the currency. High Gold reserves can be a source of trust for a country’s solvency. Central banks added 1,136 tonnes of Gold worth around $70 billion to their reserves in 2022, according to data from the World Gold Council. This is the highest yearly purchase since records began. Central banks from emerging economies such as China, India and Turkey are quickly increasing their Gold reserves.
Gold has an inverse correlation with the US Dollar and US Treasuries, which are both major reserve and safe-haven assets. When the Dollar depreciates, Gold tends to rise, enabling investors and central banks to diversify their assets in turbulent times. Gold is also inversely correlated with risk assets. A rally in the stock market tends to weaken Gold price, while sell-offs in riskier markets tend to favor the precious metal.
The price can move due to a wide range of factors. Geopolitical instability or fears of a deep recession can quickly make Gold price escalate due to its safe-haven status. As a yield-less asset, Gold tends to rise with lower interest rates, while higher cost of money usually weighs down on the yellow metal. Still, most moves depend on how the US Dollar (USD) behaves as the asset is priced in dollars (XAU/USD). A strong Dollar tends to keep the price of Gold controlled, whereas a weaker Dollar is likely to push Gold prices up.
Author

Eren Sengezer
FXStreet
As an economist at heart, Eren Sengezer specializes in the assessment of the short-term and long-term impacts of macroeconomic data, central bank policies and political developments on financial assets.