Gold Weekly Forecast: US inflation data to test buyer confidence
- Gold gathers bullish momentum and climbs to a fresh multi-week high above $2,680s.
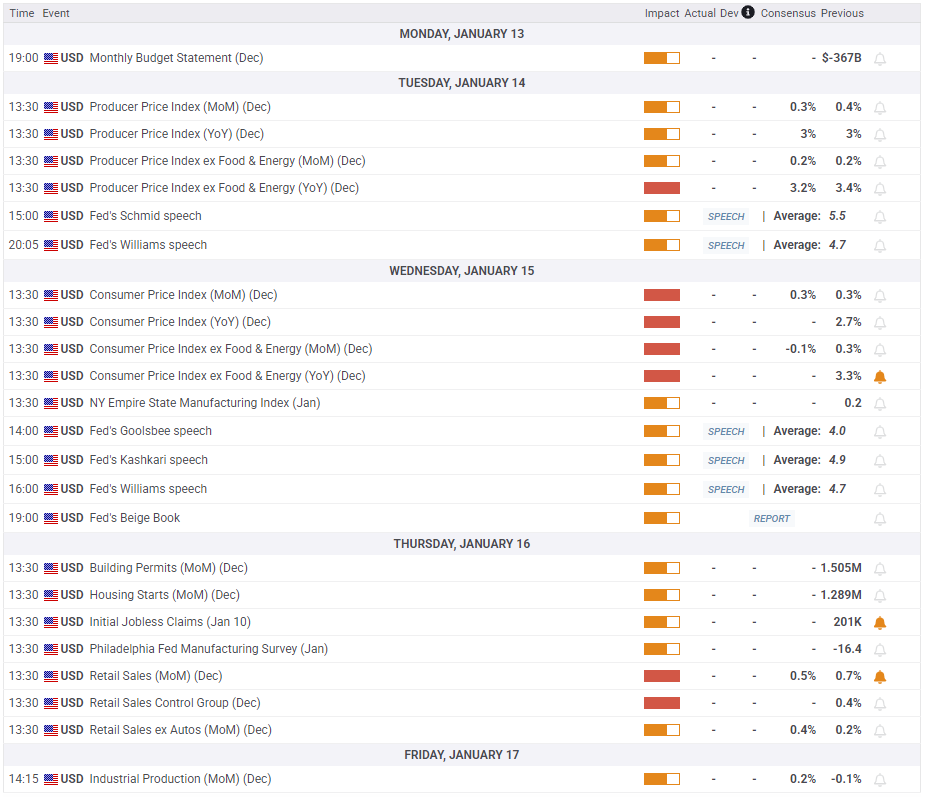
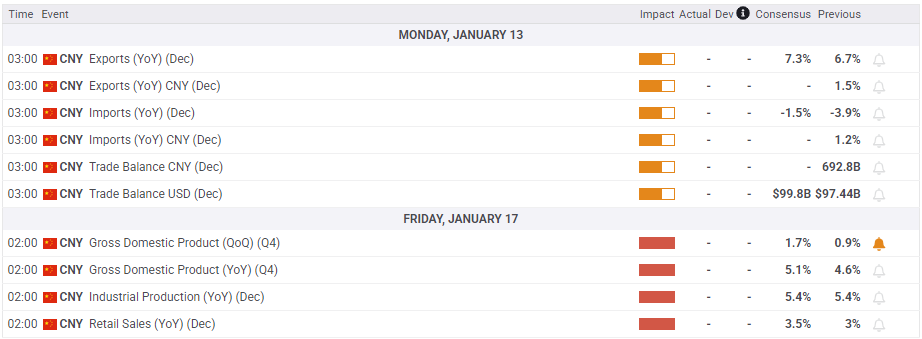
- Key data releases from China and US inflation figures could drive Gold’s valuation next week.
- The technical outlook points to a bullish shift in the near term.

Following a bearish opening to the week, Gold (XAU/USD) reversed its direction and registered gains for four consecutive days, reaching its highest level since December 13 above $2,680. As market attention turns to next week’s key data releases from China and the United States (US), Gold’s technical outlook points to a buildup of bullish momentum.
Gold gains traction as trading conditions normalize after holiday season
The improving market mood made it difficult for the US Dollar (USD) to find demand at the beginning of the week. Risk flows dominated the action in financial markets in the early American session on Monday and triggered a USD selloff. The Washington Post reported that US President-elect Donald Trump's aides were exploring tariff plans that would be applied to every country but only cover critical imports, easing fears over an aggressive tariff policy stoking inflation. With the immediate reaction, Gold advanced toward $2,650. Later in the day, XAU/USD erased its gains as Trump disputed this claim in a social media post, calling the story “just another example of fake news.”
The data from the US showed on Tuesday that the ISM Services PMI improved to 54.1 in December from 52.1 in November, pointing to an accelerating expansion in the services sector's activity. Additionally, JOLTS Job Openings rose to 8.09 million in November from 7.84 million in October. The USD benefited from the upbeat data and limited Gold’s upside.
On Wednesday, CNN reported that US President-elect Donald Trump was considering declaring a national economic emergency to allow for a new tariff program, citing four sources familiar with the matter. This headline caused markets to adopt a cautious stance and helped the US Dollar outperform its peers. In the meantime, the heavy selloff in UK Treasury bonds weighed heavily on Pound Sterling (GBP). The XAU/GBP pair rose more than 1% on the day, suggesting Gold was able to capture capital outflows out of the GBP and stay resilient against the USD.
Automatic Data Processing (ADP) reported on Wednesday that employment in the US private sector increased by 122,000 in December, missing the market expectation of 140,000. On a positive note, weekly Initial Jobless Claims declined to 201,000 in the week ending January 4 from 211,000 in the previous week. Later in the American session, the minutes of the Fed's December policy meeting showed that almost all officials said upside risks to inflation had increased and that they agreed on the need for a careful approach to further policy easing.
Stock markets in the US remained closed and bond markets closed early on Thursday in observance of a national day of mourning to honor the death of former President Jimmy Carter. Gold stretched higher in the absence of fresh fundamental developments and touched its highest level in nearly a month above $2,670.
On Friday, the US Bureau of Labor Statistics announced that Nonfarm Payrolls rose by 256,000 in December. This print surpassed the market expectation of 160,000 by a wide margin and boosted the USD. After dipping toward $2,660 with the immediate reaction, Gold regained its traction and extended its weekly uptrend.
Gold investors await US inflation data
December’s Trade Balance data from China will be watched closely by investors at the beginning of the week. A noticeable growth in China’s trade surplus could support Gold prices during the Asian session on Monday.
On Wednesday, December’s inflation data from the US could trigger the next big action in XAU/USD. Markets expect the Consumer Price Index (CPI) to increase by 0.3% on a monthly basis but see the core CPI decline by 0.1% in the same period. In case the core CPI arrives in positive territory, the immediate market reaction could boost the USD and cause Gold to stretch lower. On the flip side, a negative print could make it difficult for the USD to find demand and help XAU/USD hold its ground.
During the Asian trading hours on Friday, fourth-quarter Gross Domestic Product (GDP) data from China could influence Gold’s valuation. Analysts anticipate the Chinese economy to grow at an annual rate of 5.1%, up from the 4.6% expansion recorded in the third quarter. A positive surprise could help Gold price push higher, while a disappointing GDP print could weigh.
Market players will also keep an eye on fresh developments surrounding the Trump tariff strategy. Although Gold has been able to benefit from risk-aversion, a sharp increase in US Treasury bond yields could limit the yellow metal’s gains.
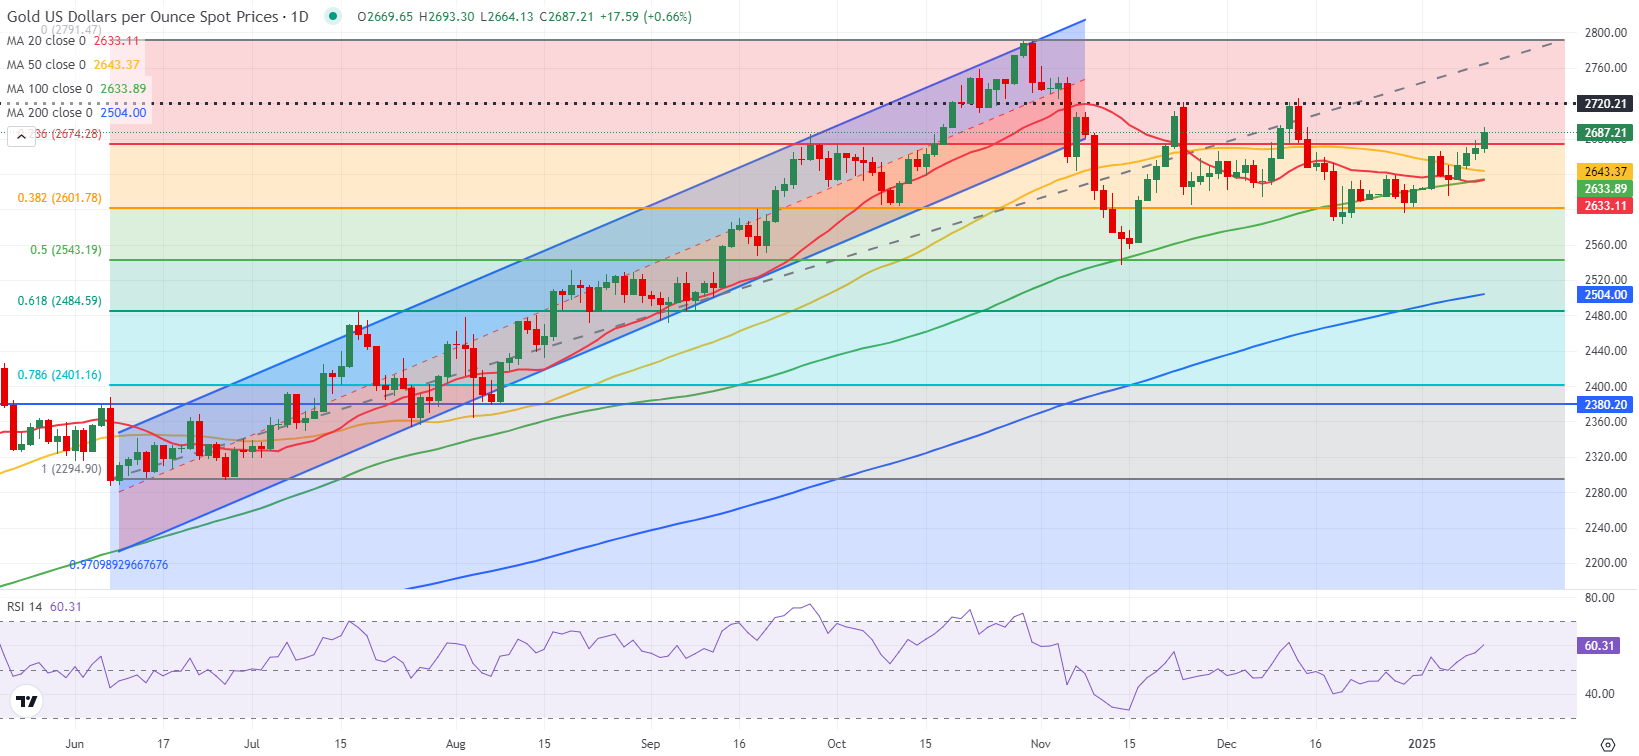
Gold technical analysis
After fluctuating near the 100-day Simple Moving Average (SMA) toward the end of the year, Gold managed to pull away from that level. Additionally, XAU/USD closed the last four days above the 20, 100 and 50-day SMAs, while the Relative Strength Index (RSI) indicator on the daily chart rose above 60, reflecting a bullish shift in the short-term bias.
The Fibonacci 23.6% retracement of the June-November uptrend aligns as a first support level at $2,675. While this level holds, technical buyers could remain interested. In this scenario, $2,720 (static level) could be seen as the next resistance before $2,790 (all-time high). On the contrary, if XAU/USD fails to stabilize above $2,675, it could lose its traction and meet the next support at $2,645-$2,635 (50-day SMA, 20-day SMA, 100-day SMA) before $2,600 (Fibonacci 38.2% retracement).
Gold FAQs
Gold has played a key role in human’s history as it has been widely used as a store of value and medium of exchange. Currently, apart from its shine and usage for jewelry, the precious metal is widely seen as a safe-haven asset, meaning that it is considered a good investment during turbulent times. Gold is also widely seen as a hedge against inflation and against depreciating currencies as it doesn’t rely on any specific issuer or government.
Central banks are the biggest Gold holders. In their aim to support their currencies in turbulent times, central banks tend to diversify their reserves and buy Gold to improve the perceived strength of the economy and the currency. High Gold reserves can be a source of trust for a country’s solvency. Central banks added 1,136 tonnes of Gold worth around $70 billion to their reserves in 2022, according to data from the World Gold Council. This is the highest yearly purchase since records began. Central banks from emerging economies such as China, India and Turkey are quickly increasing their Gold reserves.
Gold has an inverse correlation with the US Dollar and US Treasuries, which are both major reserve and safe-haven assets. When the Dollar depreciates, Gold tends to rise, enabling investors and central banks to diversify their assets in turbulent times. Gold is also inversely correlated with risk assets. A rally in the stock market tends to weaken Gold price, while sell-offs in riskier markets tend to favor the precious metal.
The price can move due to a wide range of factors. Geopolitical instability or fears of a deep recession can quickly make Gold price escalate due to its safe-haven status. As a yield-less asset, Gold tends to rise with lower interest rates, while higher cost of money usually weighs down on the yellow metal. Still, most moves depend on how the US Dollar (USD) behaves as the asset is priced in dollars (XAU/USD). A strong Dollar tends to keep the price of Gold controlled, whereas a weaker Dollar is likely to push Gold prices up.
Premium
You have reached your limit of 3 free articles for this month.
Start your subscription and get access to all our original articles.
Author

Eren Sengezer
FXStreet
As an economist at heart, Eren Sengezer specializes in the assessment of the short-term and long-term impacts of macroeconomic data, central bank policies and political developments on financial assets.


