Gold against Silver: Very important medium-term signal
Gold and silver soared and plunged together, but… Not at the same pace. And this can tell a lot.
Recent movements and their implications
The way in which both precious metals move relative to each other is not random. It has specific rhythms and patterns, and understanding what it means can give one an extra edge over other market participants. Every now and then, the gold-to-silver ratio moves in a specific manner that indicates something important for the following weeks – and that’s exactly what happened.
What you see on the below chart is the inverse of gold to silver ratio – the silver to gold ratio. It makes no difference, in which way one analyzes it, I simply prefer it to view it in this way.
Let’s check what happened.
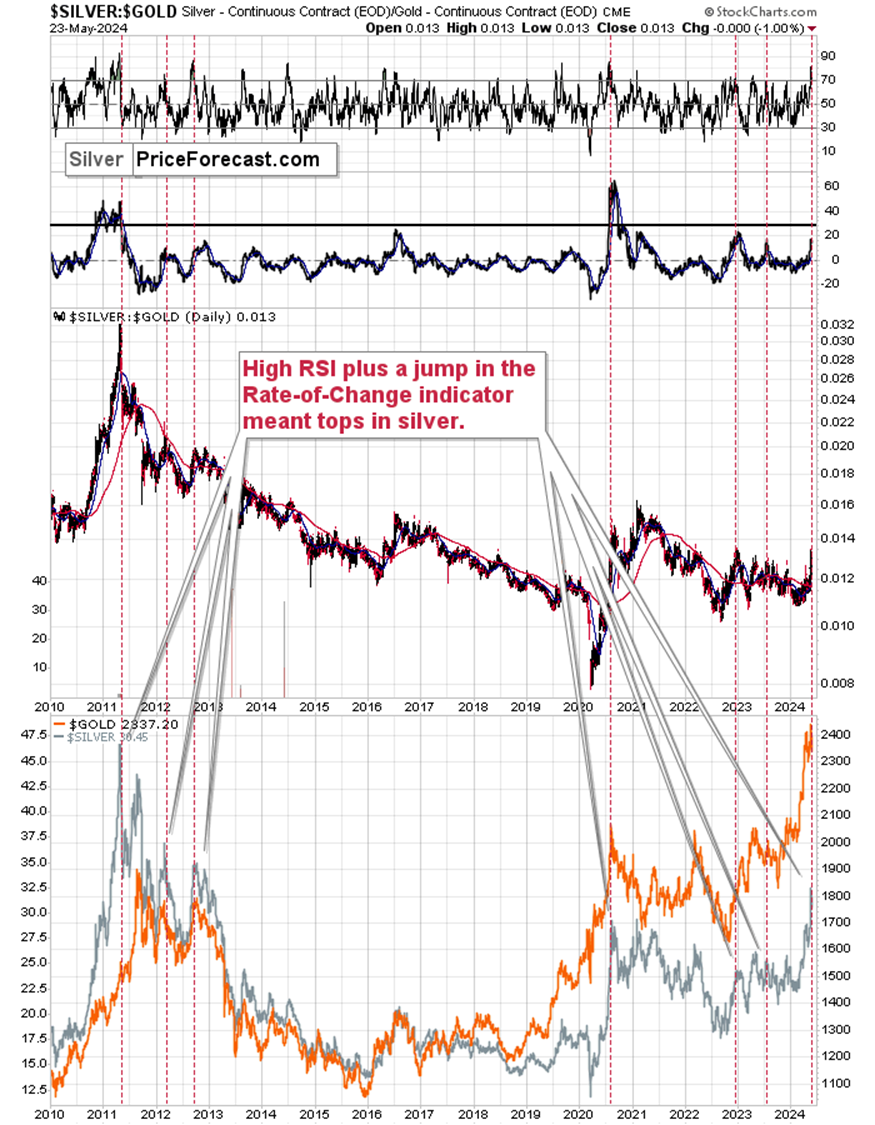
Silver soared not just on its own but also relative to gold. I wrote silver’s outperformance is usually bearish on many occasions, but the intensity with which silver showed strength recently is so significant that it’s visible on a 14-year chart!
Indicators are great tools to average out what’s not important and focus on what is and make specific situations from the past comparable. The two that are particularly useful for comparing the situations in case of the silver to gold ratio, are the Relative Strength Index (RSI) and Rate of Change (ROC) indicators.
When we saw RSI at or above 70 AND ROC after a visible run-up, silver topped. I marked those cases with red lines on the above chart. This combination of signals from both indicators worked in each case in the past 14 years, so the fact that we saw it once again does not bode well for the near-term future of the white precious metal.
Historical comparisons and current trends
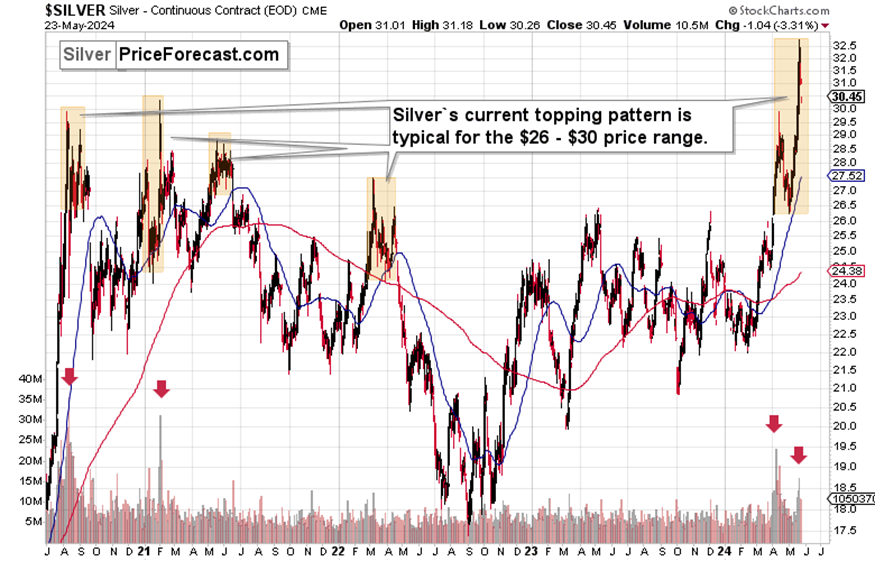
Silver soared over $32, but it’s back below $31 at the moment of writing these words. Given the momentum, the recent outperformance, and silver’s tendency to form fake breakouts, it seems that it can dive back below $30 any day now.
Last Friday, I commented on silver in the following way:
Silver soared where it had soared in 2021 at its top. It was when volume confirmed extreme interest when silver moved to the previous top, which even was at the same (nominal) price level that we see right now (approximately).
Can silver’s rally be trusted this time? Why would we?
Because silver’s fundamental picture is great (structural shortage etc.)? It was great also in 2021. And in 2008. Yet, the white metal plunged in both years and on many other occasions.
And you know what else happened more or less when silver topped in 2021? Meme stocks (e.g. GME) topped after soaring.
That’s exactly what we just saw once again!
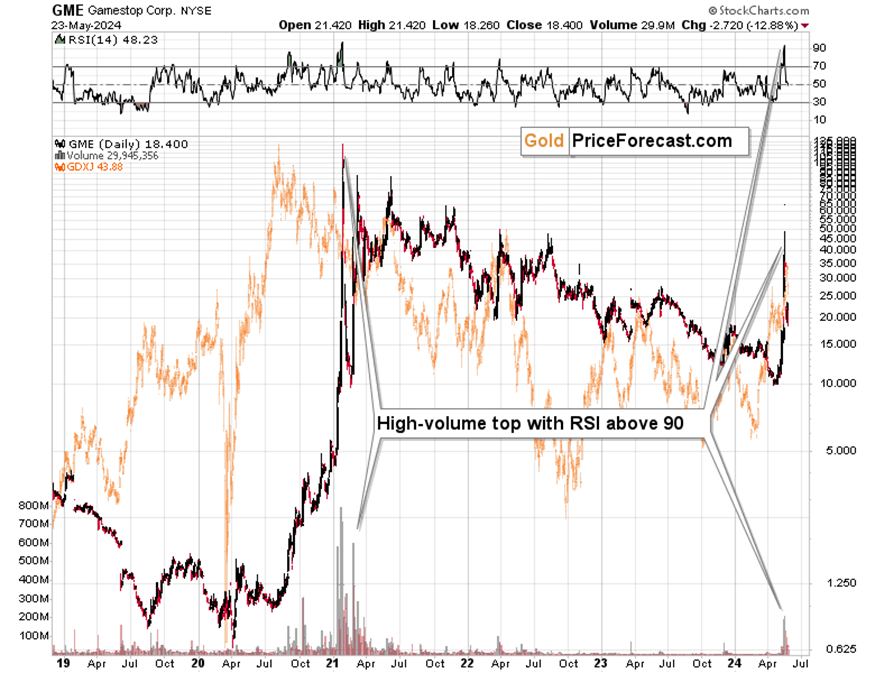
Ok, the volume is lower as fewer people are interested, but the sudden jump in prices and RSI above 90 make the analogy clear.
It’s the investment public that’s most likely buying – that’s the topping sign.
Miners declined after that top, and… Do you remember what else formed a massive, volatile top at that time when everyone and their brother expected it to shoot for the moon? Silver.
To be clear – I do think that silver is going to soar to new highs and likely well above $100 (possibly even over $200) in the following years, BUT at this very moment, silver appears to have topped, and if stocks plunge while the USD Index rallies, then the silver price would be likely slide in a particularly volatile manner.
Gold might provide a good buying opportunity soon, but I’ll leave the details to my subscribers. For now, thank you for reading today’s free analysis.
Want free follow-ups to the above article and details not available to 99%+ investors? Sign up to our free newsletter today!
Want free follow-ups to the above article and details not available to 99%+ investors? Sign up to our free newsletter today!
Author

Przemyslaw Radomski, CFA
Sunshine Profits
Przemyslaw Radomski, CFA (PR) is a precious metals investor and analyst who takes advantage of the emotionality on the markets, and invites you to do the same. His company, Sunshine Profits, publishes analytical software that any


