Gold: The tapering clock is ticking

With the FED increasingly hawkish and the USDX rising from the ashes, don’t be fooled by the recent upswing in gold. The bears are getting ready.
With the reflation trade getting cut off at the knees, the only asset class not feeling the pain is U.S. equities. However, while shorts capitulate and send the U.S. 10-Year Treasury higher (and the yield lower), the flattening of the U.S. yield curve screams of a potential recession. However, while the development is bullish for the USD Index and bearish for the PMs, investors are putting the cart before the horse.
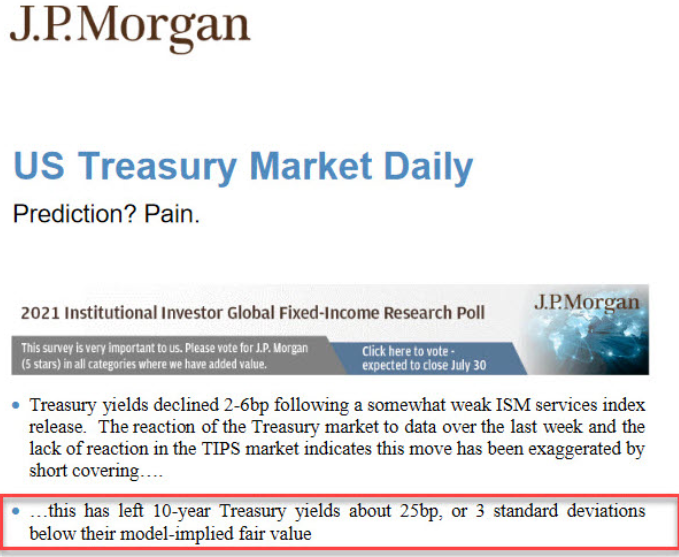
To explain, while the U.S. 10-Year Treasury yield languishes in its depressed state, J.P. Morgan told clients on Jul. 6 that the Treasury benchmark is roughly three standard deviations below its model-implied fair value. For context, J.P. Morgan believes that the U.S. 10-Year Treasury yield should trade at roughly 1.60%, and, given the three-sigma underperformance, standard normal probabilities imply a roughly 99.9% chance that the Treasury benchmark will move higher over the medium term.
However, while the bond market ‘wants what it wants’, it’s important to remember that a flattening of the U.S. yield curve has the same effect on the PMs. For example, while I’ve been warning for months that the U.S. Federal Reserve (FED) will likely taper its asset purchases much sooner than investors expect, the minority view is now the consensus. And with that, the hawkish shift reduces inflation expectations, reduces growth expectations and often results in lower long-term interest rates. However, while the U.S. 10-Year Treasury yield still remains significantly undervalued in our view, ‘the ghost of tapering past’ has investors aiming to front-run a September reveal.
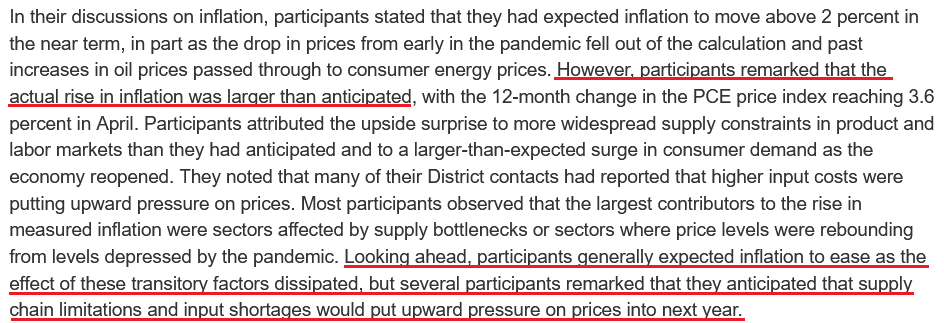
As evidence, the FED released the minutes from its Jun. 15/16 policy meeting on Jul. 7. An excerpt from the report read:
“Various participants mentioned that they expected the conditions for beginning to reduce the pace of asset purchases to be met somewhat earlier than they had anticipated at previous meetings in light of in-coming data.”
And surprise, surprise, while I’ve been warning for some time that surging inflation will likely force the FED’s hand, the report revealed:
Source: U.S. FED
The Container War
But with long-term yields signaling the death of inflation, is a regime shift already underway? Well, I warned previously that inflationary pressures are unlikely to abate anytime soon:
I wrote:
With the U.S. Census Bureau revealing on Jun. 8 that U.S. imports from China (goods) totaled nearly $38 billion in April, more and more data signals that the U.S. economy will continue to feel the inflationary burn. Shipping costs are also exploding at an unprecedented rate.
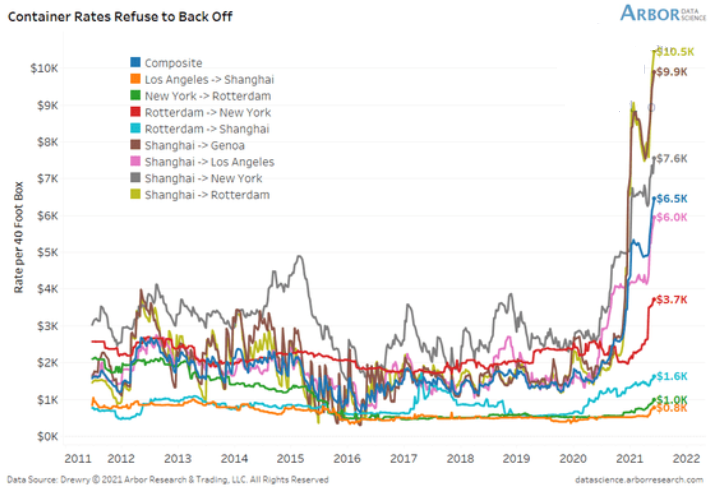
To explain, the lines above track the shipping costs to-and-from various regions. If you analyze the dark blue line sandwiched in the middle ($6.5K), average shipping costs continue to skyrocket. Moreover, if you’re shipping from Shanghai to Rotterdam, New York or Genca, global businesses are nowhere near solving these “transitory” issues.
And providing another update on Jun. 28, the situation has only worsened.
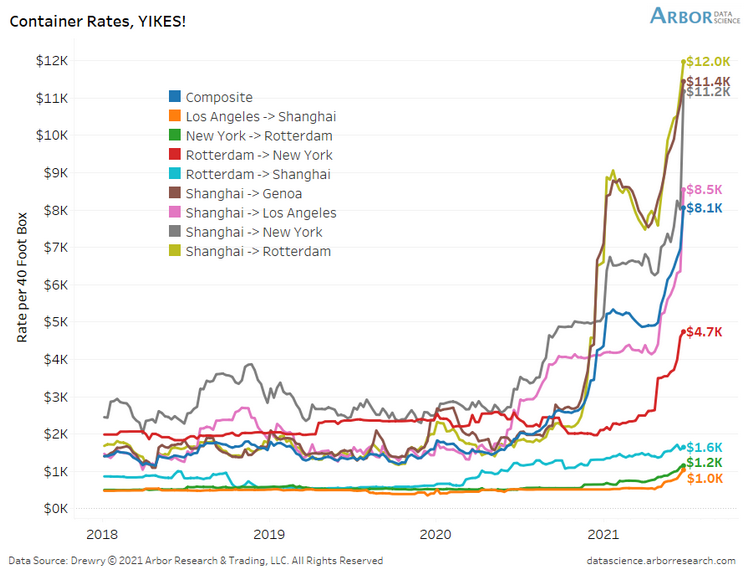
To explain, if you compare the first chart to the one directly above, you can see that the composite container rate (the dark blue line) has increased from $6.5K to $8.1K in only two weeks. What’s more, shipping from Shanghai to Rotterdam (the gold line) has increased from $10.5K to $12.0k, while Shanghai to New York (the gray line) has risen from $7.6K to $11.2K. As a result, does it seem like inflationary pressures are a thing of the past?
To that point, with the old adage implying that ‘the third time’s the charm,’ the surge lives on.
-637613496768905463.png)
To explain, the composite container rate has now gone from $6.5K through $8.1K to $8.4K in less than a month. And with shipping costs from China (Shanghai) leading the charge, the FED’s “transitory” narrative still lacks empirical credibility.
To that point, can you guess which trading partner accounts for 17.3% of U.S. imports?
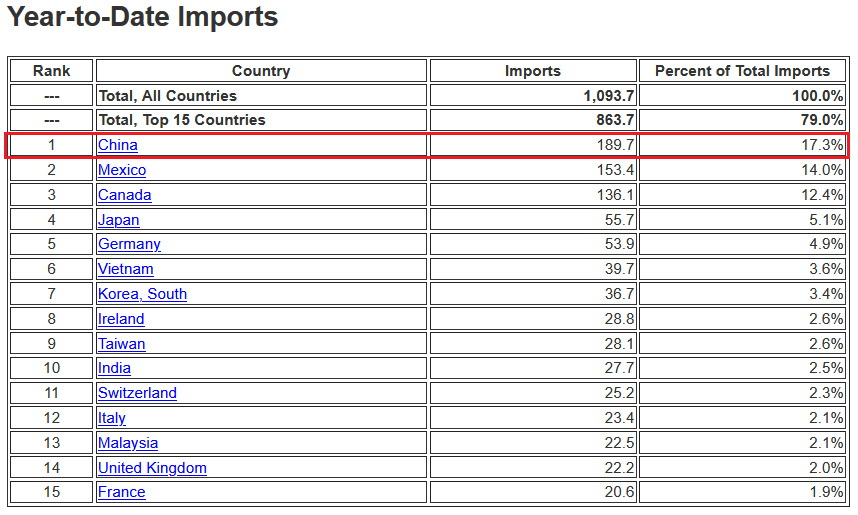
Source: U.S. Census Bureau
The bottom line? While the bond market may ‘wish upon a star,’ inflationary pressures are unlikely to subside until the FED tapers its asset purchases (and/or raises interest rates).
What can the services PMI tell us?
As further evidence, the Institute for Supply Management (ISM) released its services PMI on Jul. 6. And while the headline index declined from 64 in May (an all-time high) to 60.1 in June, inflation remained abundant:
“Prices paid by service organizations for materials and services increased in June, with the index registering 79.5 percent, 1.1 percentage points lower than May’s reading of 80.6 percent. 17 services industries reported an increase in prices paid during the month of June … [with] only [one] industry reporting a decrease.”
In addition, ISM Chair Anthony Nieves added:
“According to the Services PMI, 16 services industries [out of 18] reported growth. The composite index indicated growth for the 13th consecutive month after a two-month contraction in April and May 2020. The rate of expansion in the services sector remains strong, despite the slight pullback in the rate of growth from the previous month’s all-time high. Challenges with materials shortages, inflation, logistics and employment resources continue to be an impediment to business conditions.”
For context, the ISM requires written permission before redistributing any of its content, and that’s why I quoted the findings rather than including a screenshot of the report. However, if you want to review the source material, you can find it here.
Likewise, IHS Markit also released its U.S. services PMI on Jul. 6. An excerpt from the report read:
“Contributing to the robust rise in activity across the service sector was a further marked increase in new business at the end of the second quarter. Alongside strong customer demand, firms attributed the upturn in new sales to the acquisition of new clients. Although the rate of new business growth slipped to a three-month low, it was still the third-fastest on record.”
And following right along:
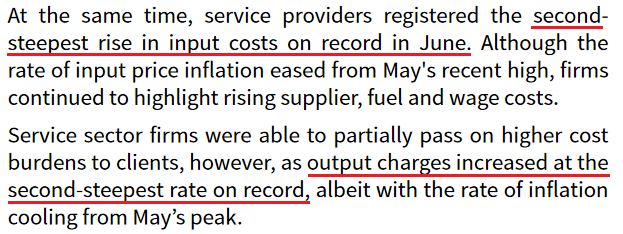
Source: IHS Markit
Furthermore, while oil prices have surged in 2021 so far, major companies haven’t increased their capital investments. As a result, not only are U.S. crude oil inventories still ~6% below their historical average (as of Jun. 30), but dormant supply could put upward pressure on prices in the coming months.
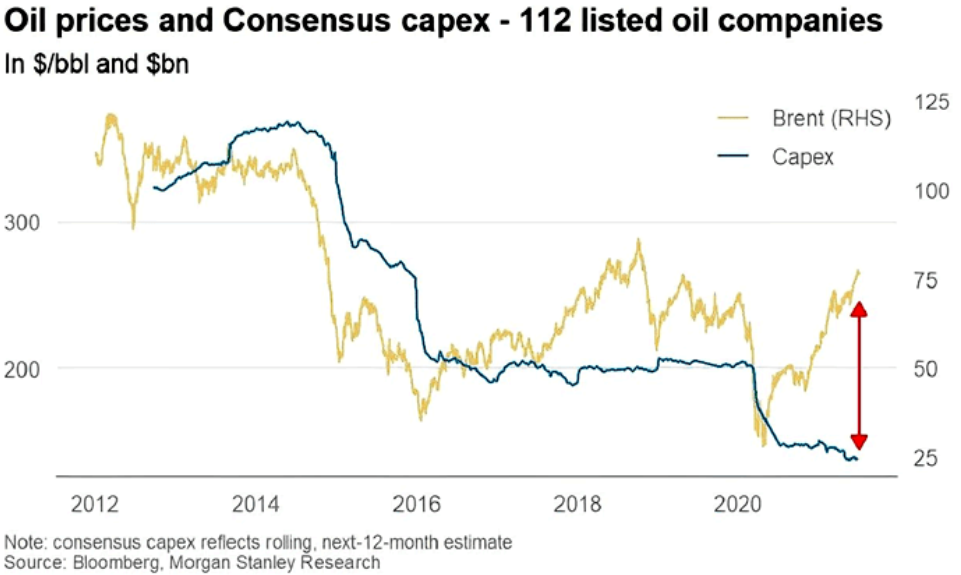
To explain, the gold line above tracks the Brent price, while the blue line above tracks major oil companies’ capital expenditures. If you analyze the right side of the chart, you can see that investments in drilling infrastructure have fallen off a cliff. And with demand likely to remain abundant as economies reopen, fuel, gasoline and heating oil prices will likely remain elevated.
The Swagger of the USDX
Finally, with the USD Index regaining its swagger and the EUR/USD falling from grace, the cocktail of a hawkish FED and fundamental underperformance is weighing heavily on the euro. Moreover, with growth differentials poised to widen in the coming months, U.S. dollar strength could cast a dark shadow over the PMs.
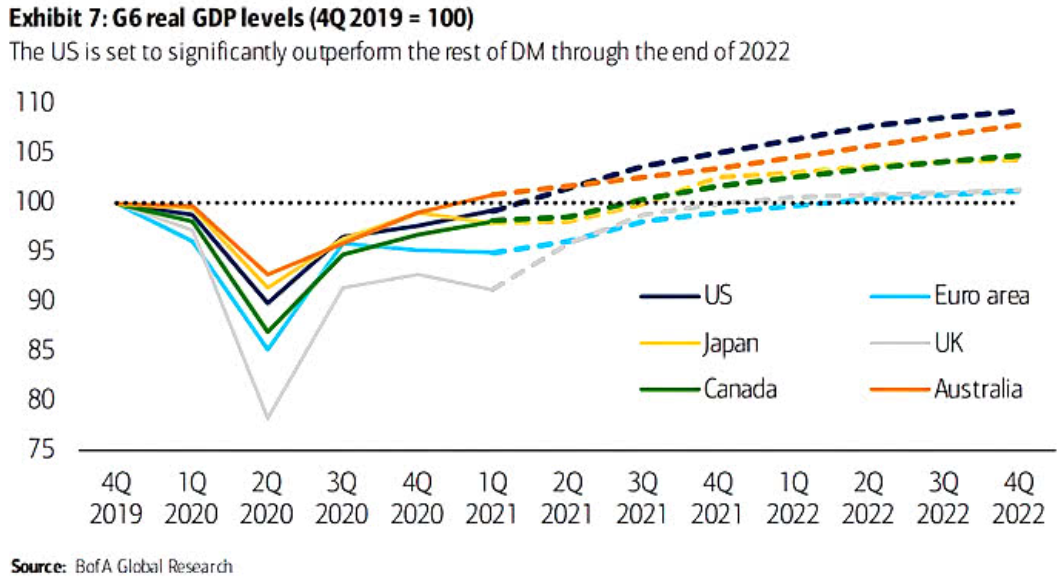
To explain, the various lines above track Bank of America’s quarterly projections for G6 real GDP levels. If you focus your attention on the dark blue (U.S.) and light blue (Eurozone) lines, you can see that the former is leading the pack, while the latter is vying for the last place. On top of that, the U.S.’s projected outperformance of Japan, Canada, and the U.K. is bullish for the USD/JPY and the USD/CAD but bearish for the GBP/USD.
In conclusion, while the PMs remain upbeat, it’s likely another case of ‘been there, done that.’ For example, it was roughly four months ago that falling real yields helped uplift gold before it eventually collapsed. And with a similar event unfolding once again, gold has demonstrated rational (though, superficial) strength. However, with the clock ticking toward a taper announcement and the USD Index rising from the ashes, the corrective upswing is likely another head fake within gold’s medium-term downtrend.
Want free follow-ups to the above article and details not available to 99%+ investors? Sign up to our free newsletter today!
Want free follow-ups to the above article and details not available to 99%+ investors? Sign up to our free newsletter today!
Author

Przemyslaw Radomski, CFA
Gold Price Forecast
Przemyslaw Radomski, CFA (PR) is a precious metals investor and analyst who takes advantage of the emotionality on the markets, and invites you to do the same. His company, Sunshine Profits, publishes analytical software that any


