Gold struggles as dollar and yields rise

Gold has extended its losses from Friday after trading flat on Monday. The precious metal was trading around $1337 at the time of this writing, so it was off nearly $25 or 1.8% from the high of $1361 reached on Friday. The buck-denominated precious metal has fallen victim to a rebounding US dollar while rising government bond yields is also weighing on the noninterest-bearing commodity. The greenback is finally responding to the rising US 10-year bond yield, which has closed in on that 3.0% hurdle, at 2.92%. Yields have been on the rise amid a sell-off in the bond markets, owing to expectations that the Federal Reserve and other major central banks would turn more aggressive in tightening their monetary policies this year thanks to an improving global economic outlook and amid concerns over inflation.
What about inflation and stock market volatility?
There are however some suggestions that inflation and the recent stock market volatility may actually be driving some interest in gold. The precious metal is considered to be an inflation hedge, among its many other uses. So, with inflation worries dominating the agenda at the moment and stock markets being at lofty levels, this may lead to more interest in gold in the long-term. However, as it is very difficult to quantify it, I can’t say gold will go up because of inflation or concern about stocks with a high degree of confidence.
Dollar is ultimately the main driver of gold prices
Indeed, ultimately it is the dollar which will have a much direct impact on the short to medium term direction of gold prices. And with the dollar finally responding to the recent improvement in US macro data, there is a possibility that gold could head sharply lower in the coming days. That being said, the dollar’s recovery could be short-lived as so far it is not clear whether the Dollar Index has bottomed out or just bouncing back from a key level, as I discussed in THIS report on Friday. Once there’s some clarity on the direction of the dollar, then we should be able to provide a more confident outlook on the direction of gold prices as currently there are many additional conflicting factors pushing it up and down.
Gold’s struggle to breakout may be a sign for concern
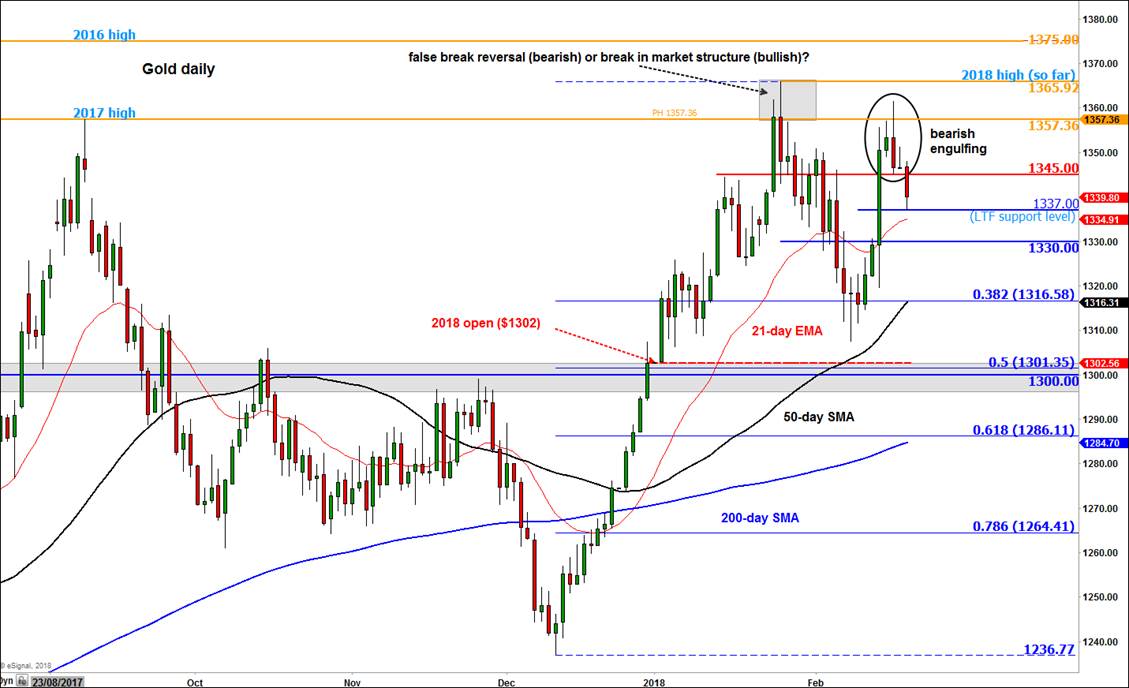
As a result, when it comes to analysing and trading gold, we are taking it from one level to the next for the time being. The metal has now had a couple of failed attempts at breaking out above last year’s high of $1357. This makes as cautious from a technical point of view as well, even if other technical indicators point to an eventual breakout. After all, the 50- and 200-day moving averages are both pointing higher and gold is currently residing above both. This objectively tells us that the trend is indeed bullish. However, it is just that we don’t like the price action around last year’s high from a bulls’ point of view. In fact, the bears would point to the failed breakout attempts as signs that the trend is turning lower, with Friday’s bearish engulfing candle providing some confirmation.
At the time of this writing, gold was testing a lower time frame (LTF) support around $1337, so there was a possibility for a rebound of some sort there. Additional support comes in at $1330. However, if this level breaks down then there is little further support seen until $1317 (38.2% Fibonacci retracement and 50-day average confluence), followed by that key long-term hurdle at $1300. On the upside, if last year’s high at $1357 eventually breaks and gold holds above it, then the next immediate target would be the liquidity that would be resting above the next swing high of $1375 – this being the 2016 peak. If gold were to get there, it could actually go a lot higher, for we will probably see the breakout traders also come into play. But we will cross that bridge when and if – a big if – we come to it.
Author

Fawad Razaqzada
TradingCandles.com
Experience Fawad is an experienced analyst and economist having been involved in the financial markets since 2010 working for leading global FX, CFD and Spread Betting brokerages, most recently at FOREX.com and City Index.


