Gold Price Weekly Forecast: Continuation of rally depends on US inflation data
- Gold price registered a weekly close above $2,000 for the first time ever.
- March inflation data from the US could provide a directional clue to XAU/USD.
- The bullish bias stays intact in the near term technical outlook.

Gold has gained traction to start the week and extended its rally after clearing $2,000. Although XAU/USD retreated in the second half of the week from the one-year high it touched above $2,030, it managed to snap a two-week losing streak and posted its first weekly close above $2,000. Next week, March inflation data from the US and trade balance figures from China could impact the precious metal’s valuation.
What happened last week?
The US Dollar (USD) came under selling pressure in the American session after the monthly PMI report published by the ISM revealed that the economic activity in the manufacturing sector continued to contract at an accelerating pace in March. Additionally, the inflation component of the survey, the Prices Paid sub-index, and the Employment sub-index both came in below 50, showing a decline in the sector’s input inflation employment. XAU/USD capitalized on the USD weakness and registered daily gains.
On Tuesday, Gold price gathered bullish momentum and surpassed $2,000. Technical buyers showed interest following this move and XAU/USD rose nearly 2% on a daily basis. The sharp decline seen in the benchmark 10-year US Treasury bond yield fueled the pair’s rally. The US Bureau of Labor Statistics (BLS) reported that the number of job openings on the last business day of February stood at 9.9 million, compared to 10.5 million in January, and caused investors to lean toward the US Federal Reserve (Fed) leaving its policy rate unchanged in May.
Although Gold price reached its highest level since March 2022 at $2,032 early Wednesday, it struggled to preserve its bullish momentum and closed the day flat. Despite the disappointing ISM Services PMI report, which highlighted a loss of momentum in the service sector’s business growth, the USD found a foothold amid risk aversion. Disappointing data releases revived fears over the US economy tipping into recession and limited XAU/USD’s upside.
Gold price staged a technical correction on Thursday as the 10-year US Treasury bond yield recovered above 3.3% from the multi-month low it set at 3.25% earlier in the week. The US Department of Labor (DOL) announced that there were 228,000 initial jobless claims in the week ending April 1, compared to the market expectation of 200,000. The DOL, however, noted that they have revised seasonal adjustment factors and markets refrained from reacting to this data.
On Friday, the BLS reported that Nonfarm Payrolls (NFP) rose by 236,000 in March and the Unemployment Rate declined to 3.5% on the back of an increase to 62.6% in Labor Force Participation rate. Furthermore, wage inflation, as measured by Average Hourly Earnings, declined to 4.2% on a yearly basis from 4.6% in February. With the initial reaction to this data, the 10-year US yield gained more than 1% in the shortened session.
Next week
Many major global and stock markets will remain closed on Easter Monday and XAU/USD is likely to stay quiet at the beginning of the week.
Late Monday or early Tuesday, a delayed reaction to the US March jobs report could be witnessed with trading volumes returning to normal levels. Improving Labor Force Participation Rate, falling wage inflation and the loss of momentum in NFP growth, which all point to softening conditions in the labor market, could translate into lower US yields and allow Gold price to gain traction. However, it’s worth remembering the uptick in yields on Friday. Markets could still see that report as “good enough” to constitute one more Fed rate increase in May. In that case, an extended rebound in yields should cap XAU/USD’s upside.
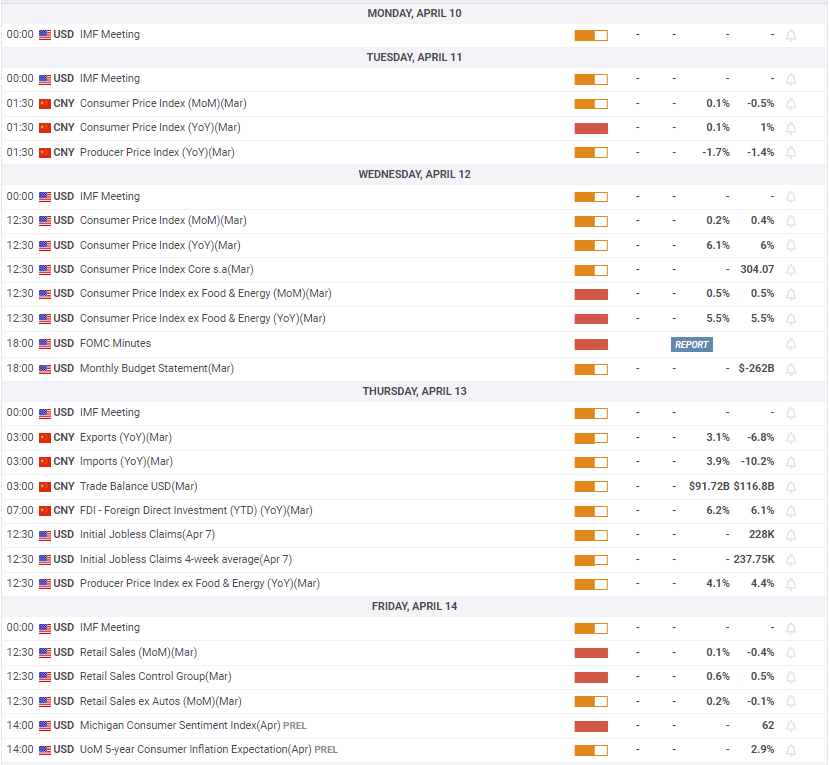
The US BLS will release the Consumer Price Index (CPI) data for March on Wednesday. The Core CPI, which excludes volatile energy and food prices, remained steady at 5.5% in February with a monthly increase of 0.5%. In March it is expected to rise by 5.6% and 0.4% respectively. In case the monthly Core inflation reading comes in softer than expected, at 0.3% or lower, markets could reconsider to price in a no-change in the Fed policy rate in May which would weigh on US T-bond yields, allowing XAU/USD to gather bullish momentum. On the other hand, a hot monthly core inflation, at 0.7% or higher, is likely to cause investors to continue to bet on a 25 bps hike and have the opposite effect on the pair’s action.
In the Asian trading hours on Thursday, Trade Balance data from China will be watched closely by market participants. Markets forecast the trade surplus to decline to $91.72 billion in March from $116.8 billion in February. Earlier this week, International Monetary Fund (IMF) Managing Director Kristalina Georgieva said they project the global economy to grow by less than 3% in 2023, down from 3.4% in 2022. A disappointing trade report from China could revive concerns over a global economic slowdown and weigh on Gold price and vice versa.
Finally, March Retail Sales and the University of Michigan’s Consumer Sentiment Index for April will be featured in the US economic docket on Friday. A sharp decline in Retail Sales could hurt the USD and help XAU/USD end the week on a firm footing but it would be surprising to see the data having a long-lasting impact on the USD’s valuation.
Gold price technical outlook
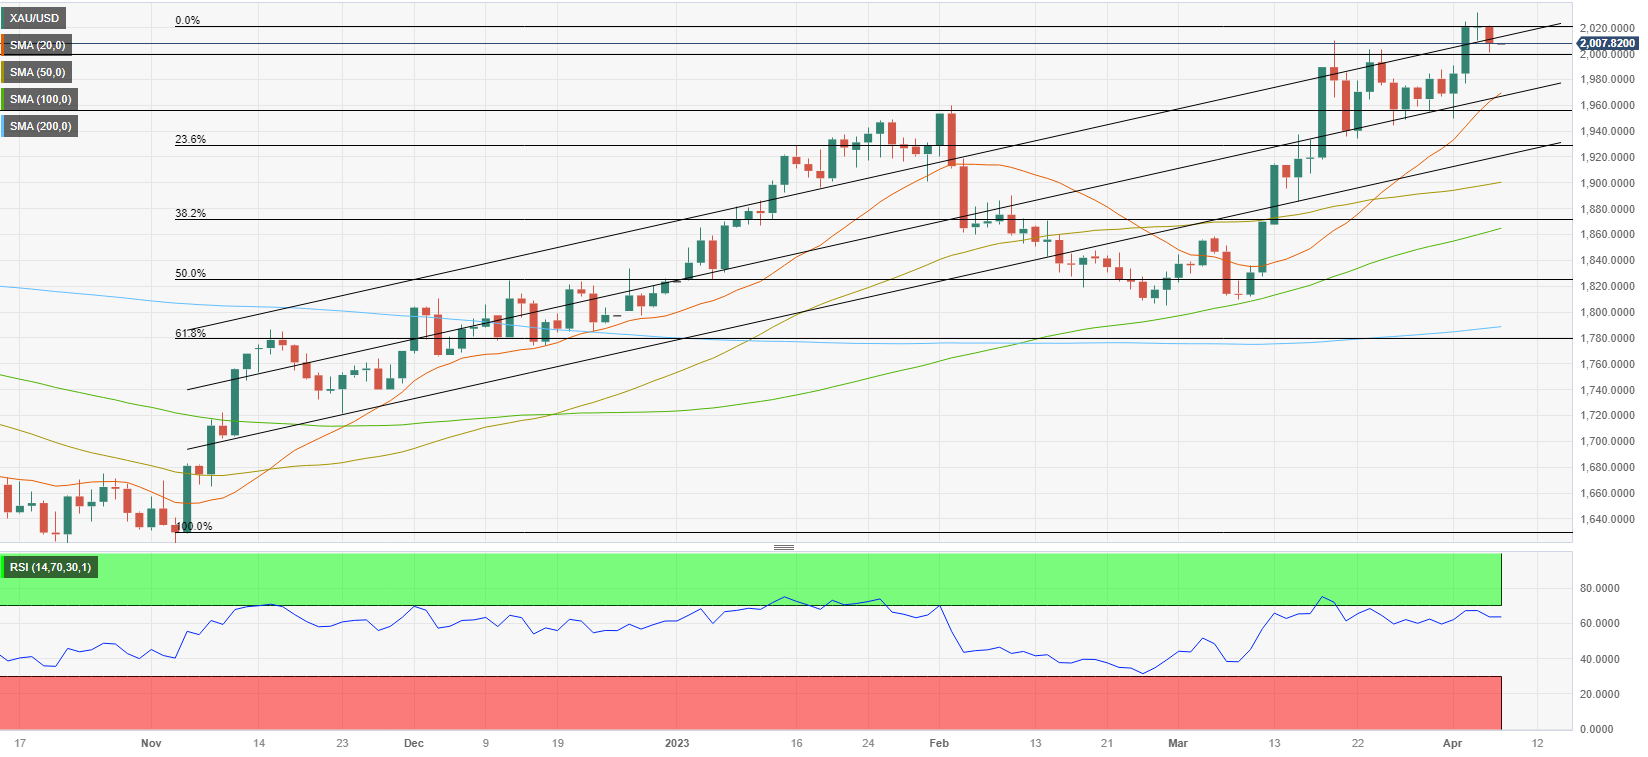
XAU/USD’s pullback on Wednesday and Thursday looks to be a technical correction following the pair’s climb outside of the ascending regression channel coming from November. The Relative Strength Index (RSI) indicator on the daily chart holds near 60, suggesting that the bullish bias stays intact in the near term.
In case the pair extends its correction, $2,000 (psychological level, static level) aligns as initial support. With a daily close below that level, additional losses toward $1,980 (20-day Simple Moving Average (SMA), mid-point of the ascending channel) and $1,960 (static level) could be witnessed.
If $2,000 stays intact, Gold price could stay in a consolidation phase early next week before targeting $2,020 (static level), $2,032 (one-year high set on April 5) and finally $2,050 (static level from March 2022).
Author

Eren Sengezer
FXStreet
As an economist at heart, Eren Sengezer specializes in the assessment of the short-term and long-term impacts of macroeconomic data, central bank policies and political developments on financial assets.