Gold price slides even without Dollar’s help

Gold slides once again today, proving that yesterday’s $67 slide was not accidental.
Recent trends in Gold and USD index
And it’s happening without a rally in the USD Index. So, yes, the price of the yellow metal can indeed move also down, not only up. And since the medium-term trend in junior mining stocks did not change despite gold’s recent upswing, the next short-term slide in the latter is likely to be very powerful. Yes, the GDXJ declined by almost 5% yesterday, but this slide – even though it seems significant from the day-to-day point of view – is likely nothing compared to what’s to come.
On April 15, 2024, I wrote the following
Gold’s huge-volume reversal is definitely THE news that got the spotlight last week. What does it mean?
It most likely means that “this is it”. This was the final top for the price of gold for at least some time. At least that’s what the huge-volume sessions meant previously, especially when gold was similarly overbought as it was recently.
Indeed, this appears to have be the case.
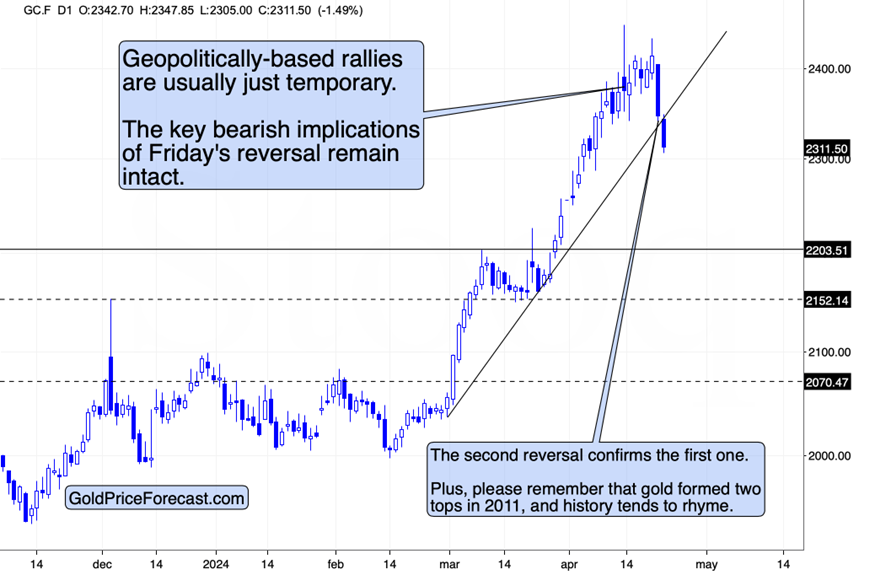
Gold price is already down by almost $150 from its recent high (and about $100 lower this week), and it just moved below its rising support line. This IS bearish on its own but it’s MUCH more bearish that it’s all taking place while the USD Index is consolidating.
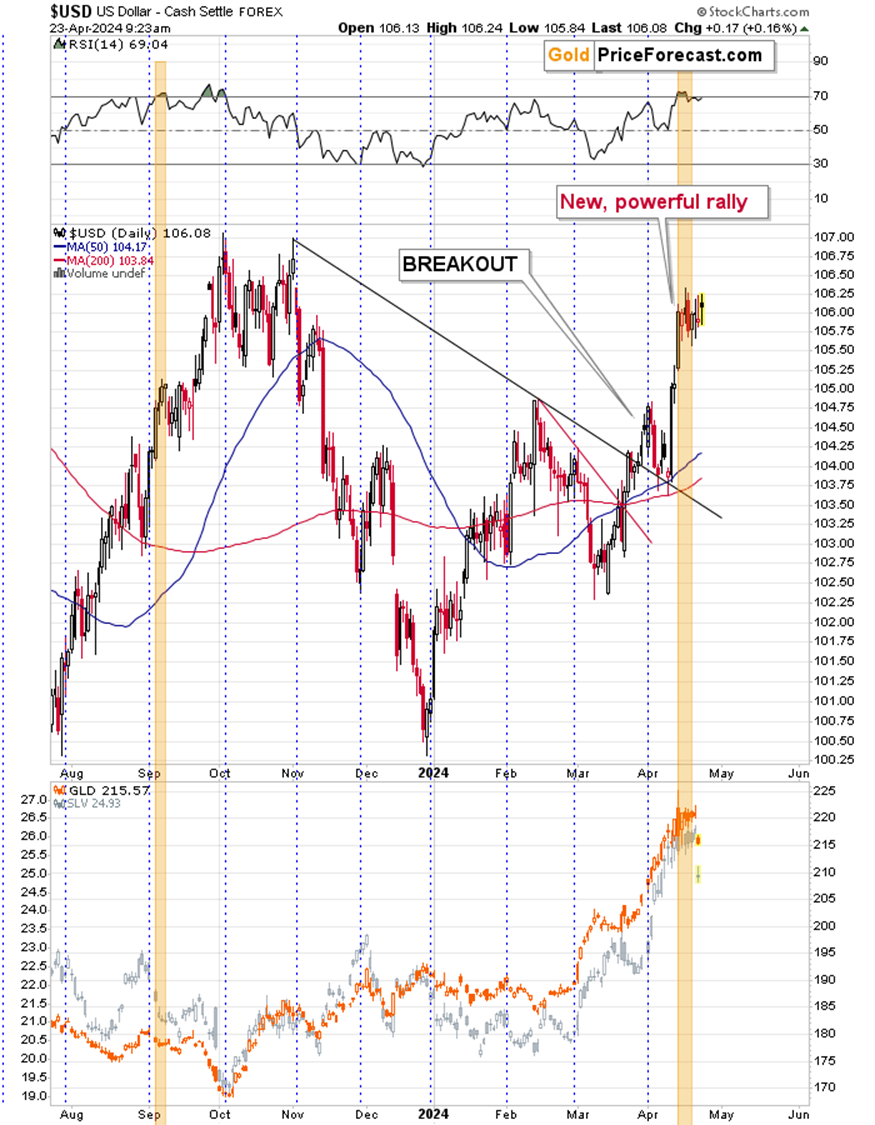
It’s usually been the case that rallies in the USD Index generated declines in gold. This was not really the case in the last few months, as gold soared regardless of dollar’s rally. At some point, one might have thought to themselves that there’s no stopping gold since even higher USDX values can’t trigger declines in it.
Bearish indicators for Gold
In reality, gold did have its own run, but it doesn’t imply that the gold-USD link is gone. It was gone… for some time. It’s not possible for the price of a given asset / commodity to really uncouple from the value of the currency that it’s priced in.
And, as you can see right now, the temporary lack of direct correlation between gold and the USD Index can also make gold slide, not just rally.
Whatever we saw recently appears to have reversed. The “gold will now rally even despite dollar’s strength” now becomes “gold will now decline even despite dollar’s weakness/consolidation”.
But guess what – the USD Index is not likely to be weak here. It’s taking a breather – that’s true – but looking at it from the long-term point of view, it becomes clear that the rally has only begun.
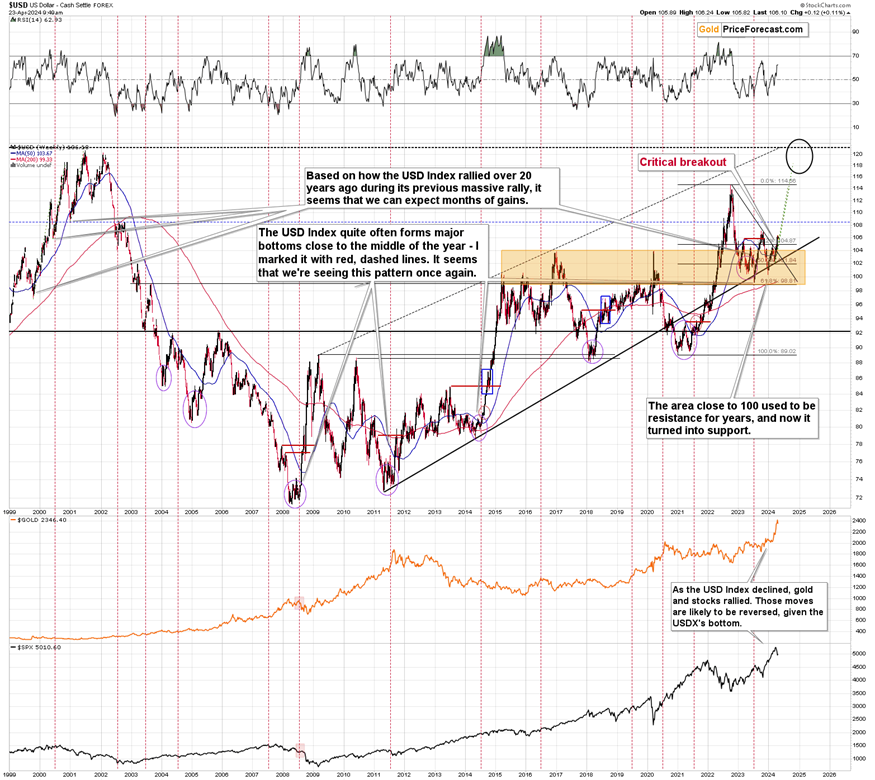
Please note that the last few months were not the only time that the gold-USD link was weak. For example, we saw something like that in 2010 – the USD Index soared, while gold declined just a little, and then it gold rallied when the USDX gave away its gains.
However, next year (and in the following months) the link was back – the 2011 bottom in the USD Index approximately corresponded to a major top in gold – and as a multi-year rally in the USD Index started at that time, so did a multi-year decline in gold.
So, yes, looking at what the USD Index is doing is and will be very important going forward. It’s not the only factor that’s important while determining gold prices, but it’s one that should not be ignored.
Want free follow-ups to the above article and details not available to 99%+ investors? Sign up to our free newsletter today!
Want free follow-ups to the above article and details not available to 99%+ investors? Sign up to our free newsletter today!
Author

Przemyslaw Radomski, CFA
Gold Price Forecast
Przemyslaw Radomski, CFA (PR) is a precious metals investor and analyst who takes advantage of the emotionality on the markets, and invites you to do the same. His company, Sunshine Profits, publishes analytical software that any


