Gold Price Forecast: XAU/USD tests critical daily support line, as sellers refuse to give up
- Gold price remains in the red below $2,400 early Wednesday, as markets stabilize.
- The US Dollar picks up fresh bids on the USD/JPY upsurge and the US Treasury bond yields upswing.
- Gold price teases a symmetrical triangle breakdown on the daily chart.

Gold price is extending its losing momentum into the fifth straight day on Wednesday, approaching the weekly low of $2,364 amid a broadly firmer US Dollar (USD) and an uptick in the US Treasury bond yields.
Gold price remains vulnerable despite dovish Fed bets
The US Dollar has come under renewed buying pressure, courtesy of the latest leg higher in the USD/JPY pair and renewed upside in the US Treasury bond yields. Markets appear to have stabilized after the recent turmoil, reducing the haven demand for the US government bonds while lifting the US Treasury bond yields higher across the curve.
The US S&P 500 futures, a risk barometer, reversed early losses to trade 0.55% higher on the day. Meanwhile, Asian markets advance, led by a 4% rally in the Japanese equity indices.
The surge in the Japanese stock markets could be attributed to a fresh sell-off in the Yen after dovish remarks from the Bank of Japan (BoJ) Deputy Governor Shinichi Uchida. Uchida said that the bank “won’t raise rates further if markets are unstable”, adding that it is “appropriate to adjust the degree of monetary easing.”
With the Japanese Yen under fresh downward pressure, USD/JPY spiked nearly 200 pips to 147.50, driving the US Dollar Index higher in tandem. This, in turn, remains a drag on the USD-denominated Gold price even as markets continue to price in aggressive interest-rate cut by the US Federal Reserve (Fed) this year.
Markets are now wagering a 70% chance of the Fed cutting rates by 50 bps in September, the CME Group's FedWatch tool showed, compared with an 85% chance a day earlier, with major brokerages also anticipating a large rate cut in the next meeting, per Reuters.
Looking ahead, Gold price will remain at the mercy of the risk trends, the USD/JPY moves driven Greenback price action and the expectations surrounding the Fed easing, in the absence of any top-tier US economic data releases. Further, traders will pay close attention to any updates on the geopolitical front, especially with the looming risks of an Iran-Israel war.
Following recent days of volatility on US economic slowdown concerns, the sentiment on Wall Street will also play a pivot role in influencing the value of the US Dollar and Gold price going forward.
Gold price technical analysis: Daily chart
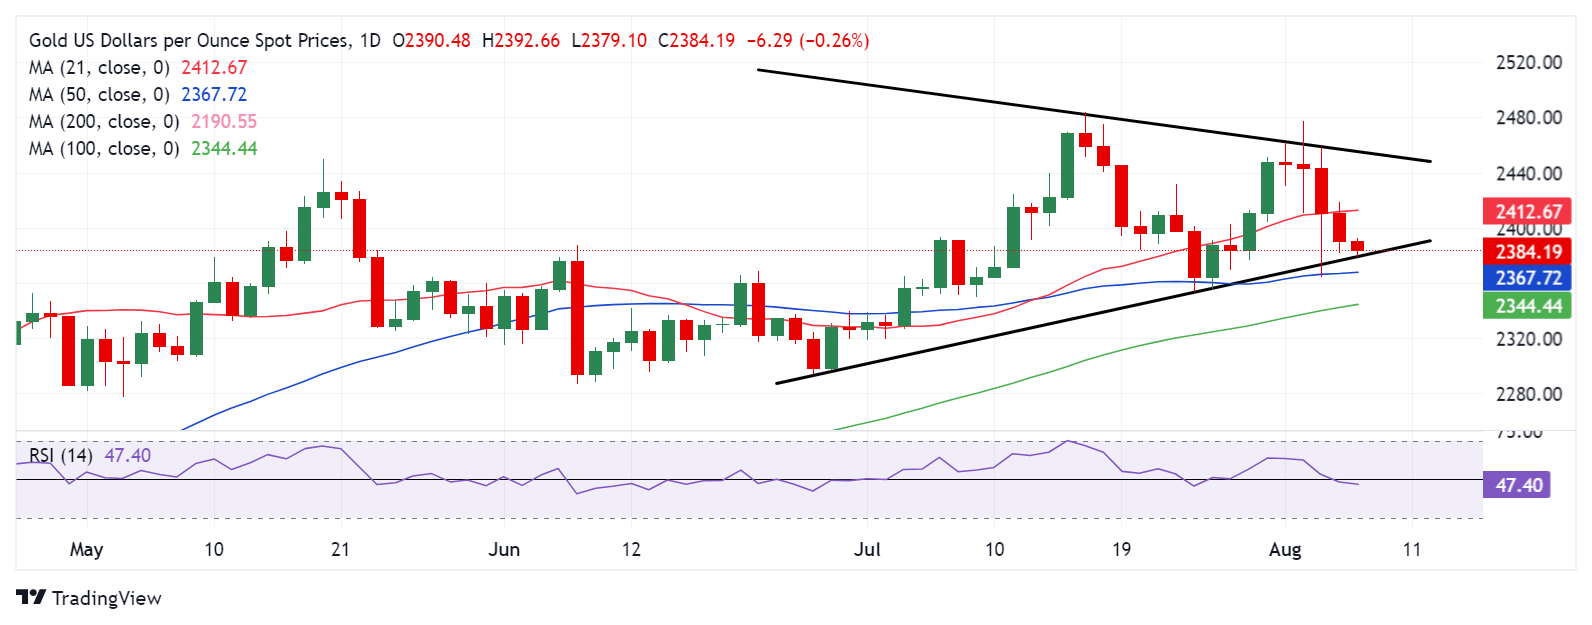
As observed on the daily chart, Gold price finally yielded a daily candlestick closing below the key 21-day Simple Moving Average (SMA) support, then at $2,411.
The decisive break of the latter triggered a renewed downside for Gold price, with the key leading indicator, the 14-day Relative Strength Index (RSI), swinging back into bearish territory. The RSI is currently trading below 50, at 47.50.
With sellers commanding the game, Gold price is set to chart a downside break from a seven-week-old symmetrical triangle formation should the rising trendline support at $2,378 give way on a sustained basis.
If the triangle breakdown is confirmed, the immediate support would be seen at the 50-day SMA of $2,368, below which the $2,350 psychological level will get tested.
Further south, the 100-day SMA at $2,344 could act as a tough nut to crack for Gold sellers.
On the flip side, Gold price needs to recapture $2,400 on a potential rebound, above which the 21-day SMA support-turned-resistance, now at $2,415 will come into the picture.
The next relevant upside target is aligned at static resistance at $2,425.
Gold FAQs
Gold has played a key role in human’s history as it has been widely used as a store of value and medium of exchange. Currently, apart from its shine and usage for jewelry, the precious metal is widely seen as a safe-haven asset, meaning that it is considered a good investment during turbulent times. Gold is also widely seen as a hedge against inflation and against depreciating currencies as it doesn’t rely on any specific issuer or government.
Central banks are the biggest Gold holders. In their aim to support their currencies in turbulent times, central banks tend to diversify their reserves and buy Gold to improve the perceived strength of the economy and the currency. High Gold reserves can be a source of trust for a country’s solvency. Central banks added 1,136 tonnes of Gold worth around $70 billion to their reserves in 2022, according to data from the World Gold Council. This is the highest yearly purchase since records began. Central banks from emerging economies such as China, India and Turkey are quickly increasing their Gold reserves.
Gold has an inverse correlation with the US Dollar and US Treasuries, which are both major reserve and safe-haven assets. When the Dollar depreciates, Gold tends to rise, enabling investors and central banks to diversify their assets in turbulent times. Gold is also inversely correlated with risk assets. A rally in the stock market tends to weaken Gold price, while sell-offs in riskier markets tend to favor the precious metal.
The price can move due to a wide range of factors. Geopolitical instability or fears of a deep recession can quickly make Gold price escalate due to its safe-haven status. As a yield-less asset, Gold tends to rise with lower interest rates, while higher cost of money usually weighs down on the yellow metal. Still, most moves depend on how the US Dollar (USD) behaves as the asset is priced in dollars (XAU/USD). A strong Dollar tends to keep the price of Gold controlled, whereas a weaker Dollar is likely to push Gold prices up.
Premium
You have reached your limit of 3 free articles for this month.
Start your subscription and get access to all our original articles.
Author

Dhwani Mehta
FXStreet
Residing in Mumbai (India), Dhwani is a Senior Analyst and Manager of the Asian session at FXStreet. She has over 10 years of experience in analyzing and covering the global financial markets, with specialization in Forex and commodities markets.


