Gold Price Forecast: XAU/USD set to challenge key $2,360 support ahead US Q2 GDP
- Gold price sees a steep fall to $2,370, hits fresh 10-day lows early Thursday.
- China’s economic woes-driven risk-aversion triggers ‘sell everything mode.’
- US Dollar bears the brunt of the Japanese Yen carry trade unwinding.
- Gold sellers need acceptance below 50-day SMA, with eyes on key US GDP and PCE data.

Gold price is licking its wound, having seen a dramatic fall to near $2,370 in Asian trading after the $2,400 threshold gave way. Gold sellers refuse to give up, anticipating the advance US second-quarter Gross Domestic Product (GDP) data due later on Thursday.
Gold price set for more pain on US GDP release?
The bearish pressure around Gold price remains unabated, as markets resort to ‘sell everything mode’ amid intense risk-aversion, fuelled by mounting economic worries in China.
As China's slowdown concerns accentuate, the People’s Bank of China (PBOC), China's central bank, cut the one-year Medium-term Lending Facility (MLF) rate from 2.50% to 2.30% on Thursday.
Industrial and Commercial Bank of China (ICBC), Agricultural Bank of China (AgBank), China Construction Bank, Bank of China and Bank of Communications cut deposit rates by 5 to 20 basis points (bps), according to statements on their websites.
These rate cuts by Chinese banks leave markets unimpressed, as they sound more like alarm bells for more economic pain in the offing for China. Slowing Chinese economic growth could heavily impact physical demand for Gold, as China is the world’s top yellow metal consumer.
Meanwhile, amidst a broader market sell-off, the US Dollar and the US Treasury bond yields also follow suit, unable to lend support to Gold price. The Greenback bears the brunt of the relentless USD/JPY sell-off, as the Japanese Yen keeps pushing higher on carry trades unwinding, courtesy of the divergent monetary policy outlook between the US Federal Reserve (Fed) and the Bank of Japan (BoJ).
Attention now turns toward the US Q2 GDP data release in the US session ahead, with a weaker print likely to reinforce expectations of two interest-rate cuts by the Fed this year. Markets are fully pricing in a rate cut in September, according to the CME Group’s FedWatch Tool.
The quarterly PCE inflation readings will also grab the market’s attention ahead of Friday’s monthly release.
The preliminary US annualized GDP is likely to rise to 2.0% in Q2, against a 1.4% growth reported previously. Meanwhile, the US GDP is set to increase by 2.6% QoQ in Q2 vs. 3.1% seen in Q1.
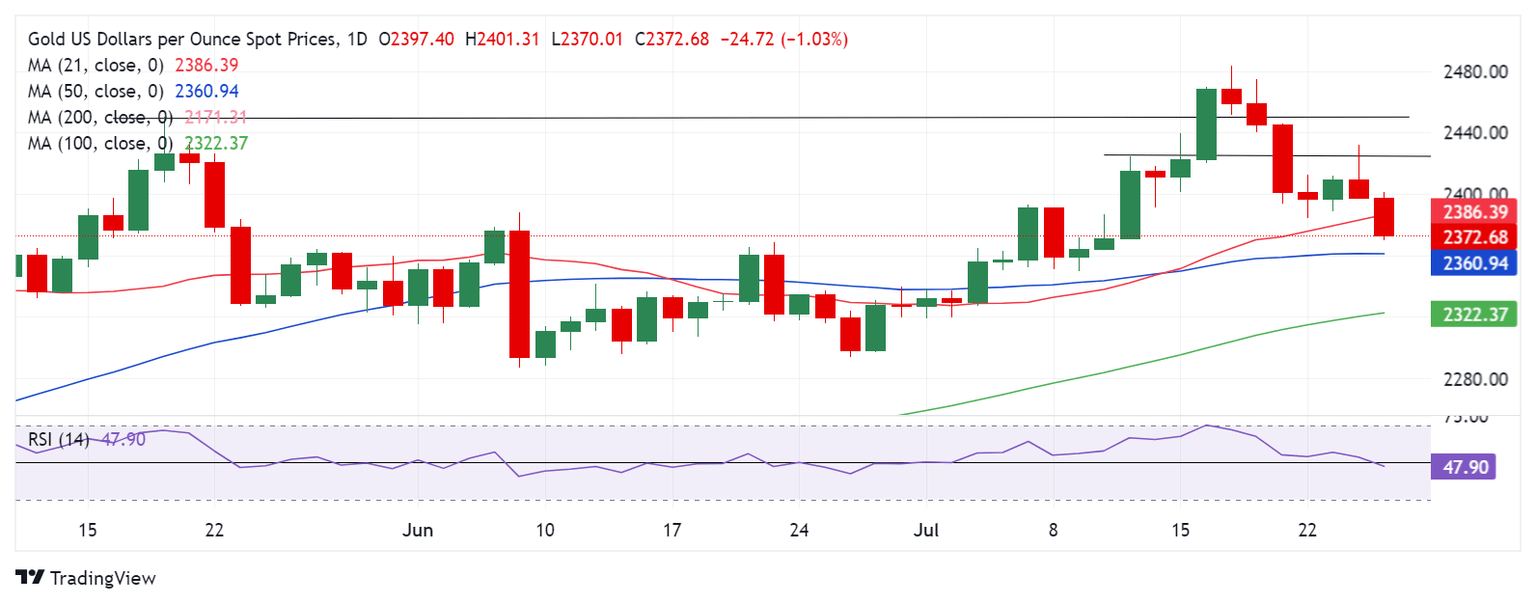
Gold price technical analysis: Daily chart
The tide has turned in favor of Gold sellers, as the 14-day Relative Strength Index (RSI) pierces through the 50 level for the downside.
Gold price failed to sustain above the $2,425 static resistance and, therefore, a fresh downtrend ensued. The selling momentum gathered pace on a breach of the $2,400 barrier.
Failure to defend the 50-day Simple Moving Average (SMA) at $2,360 will accelerate declines toward the 100-day SMA support at $2,322. Ahead of that, the $2,350 psychological level could come to the rescue of Gold buyers.
On the flip side, the immediate resistance is seen at the previous support of the 21-day SMA at $2,386, above which the $2,400 mark could be retested.
The next recovery targets are seen at the $2,412 area and the $2,425 static resistance.
Economic Indicator
Gross Domestic Product Annualized
The real Gross Domestic Product (GDP) Annualized, released quarterly by the US Bureau of Economic Analysis, measures the value of the final goods and services produced in the United States in a given period of time. Changes in GDP are the most popular indicator of the nation’s overall economic health. The data is expressed at an annualized rate, which means that the rate has been adjusted to reflect the amount GDP would have changed over a year’s time, had it continued to grow at that specific rate. Generally speaking, a high reading is seen as bullish for the US Dollar (USD), while a low reading is seen as bearish.
Read more.Next release: Thu Jul 25, 2024 12:30 (Prel)
Frequency: Quarterly
Consensus: 2%
Previous: 1.4%
Source: US Bureau of Economic Analysis
The US Bureau of Economic Analysis (BEA) releases the Gross Domestic Product (GDP) growth on an annualized basis for each quarter. After publishing the first estimate, the BEA revises the data two more times, with the third release representing the final reading. Usually, the first estimate is the main market mover and a positive surprise is seen as a USD-positive development while a disappointing print is likely to weigh on the greenback. Market participants usually dismiss the second and third releases as they are generally not significant enough to meaningfully alter the growth picture.
Premium
You have reached your limit of 3 free articles for this month.
Start your subscription and get access to all our original articles.
Author

Dhwani Mehta
FXStreet
Residing in Mumbai (India), Dhwani is a Senior Analyst and Manager of the Asian session at FXStreet. She has over 10 years of experience in analyzing and covering the global financial markets, with specialization in Forex and commodities markets.


