Gold Price Forecast: XAU/USD remains stuck in range ahead of US inflation test
- Gold prices return to the red on early Tuesdays but remain in a familiar range near $2,500.
- The US Dollar holds recovery amid US Treasury bond yields bounce and souring sentiment.
- For how long can Gold buyers defend 21-day SMA at $2,499? The daily RSI stays bullish for now.

Gold price is trading on a slippery slope, battling $2,500 in Tuesday’s trading so far. Despite a minor retreat, Gold price remains within its recent range, with traders refraining from placing fresh bets on the bright metal ahead of critical US Consumer Price Index (CPI) data due on Wednesday.
Gold price struggles amid fading bets of outsized Fed rate cut
Gold price is challenging the critical short-term daily support level, now at $2,499, yet again amid a modest uptick in the US Treasury bond yields and sustained US Dollar strength. The return of risk-off flows in Asia, in the face of looming concerns over a Chinese economic slowdown, keeps the haven demand for the US Dollar supported even as markets lower bets for a 50 basis points (bps) interest rate cut by the US Federal Reserve (Fed) next week.
A weak US labor market report failed to convince markets of an outsized rate cut by the world’s most powerful central bank this month amid lingering US ‘hard-landing’ fears.
Markets are currently pricing in a 29% chance of a 50 bps rate cut move, down from about 47% seen pre-NFP data release, the CME Group’s FedWatch Tool shows. About 110bps worth of cuts are priced in for the rest of the year.
Against this background, the Wall Street indices rebounded firmly but the US Treasury bond yields downtrend enabled the non-yielding Gold price to stage a brief comeback on Monday.
All eyes remain on the US inflation data due
on Wednesday. The data is likely to ramp up volatility around the US Dollar and, in turn, the Gold price. US inflation data will be key to determining Fed rate cuts beyond September.
In the meantime, Gold price will remain at the mercy of risk trends, in the absence of top-tier US data on Tuesday. Additionally, the Fed entered its ‘blackout period’ on Saturday ahead of the September 18 policy decision, leaving Gold price gyrating in a familiar range.
Gold price technical analysis: Daily chart
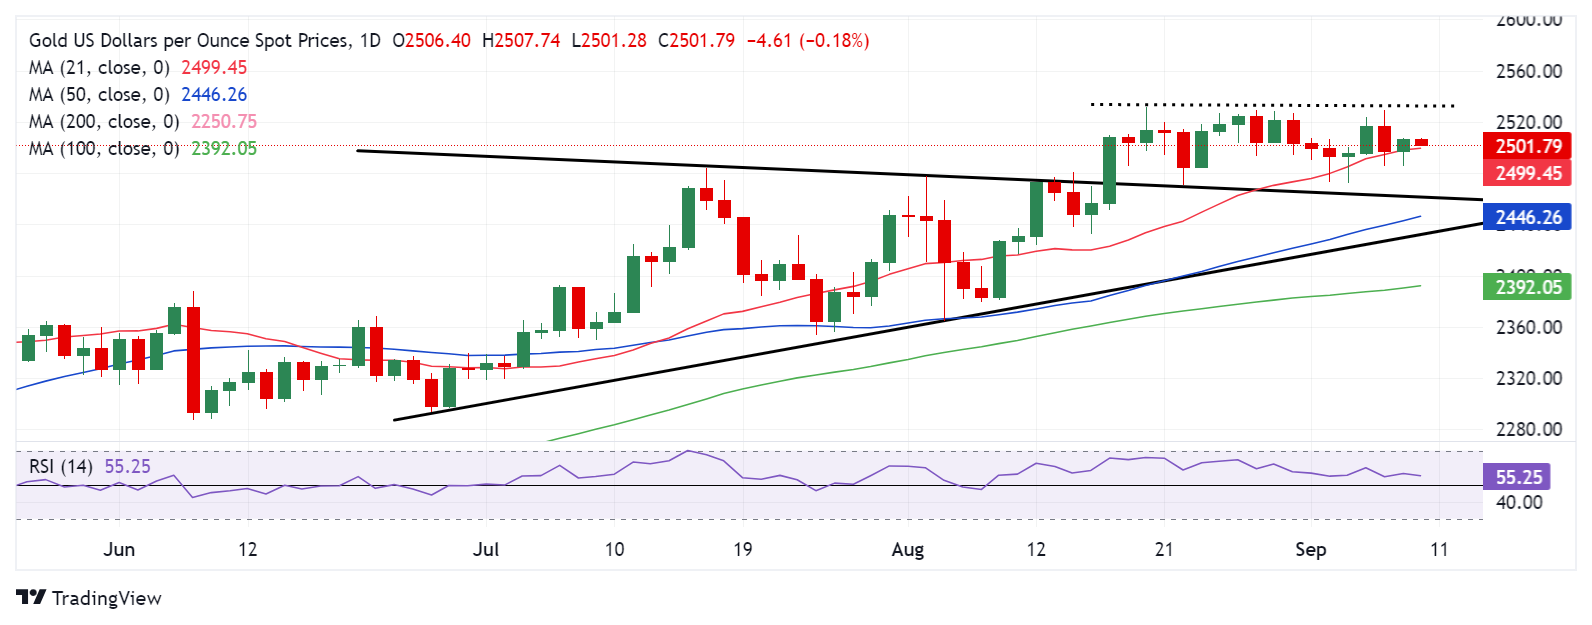
Nothing seems to have changed for Gold price from a short-term technical perspective, as buyers continue to stay hopeful so long as the 21-day Simple Moving Average (SMA), now at $2,499, is being defended.
The 14-day Relative Strength Index (RSI) has turned slightly lower, still remains well above the 50 level, supporting the bullish bias.
After recapturing the $2,500 level on a daily closing basis on Monday, Gold buyers now aim for the record high of $2,532, above which the $2,550 psychological level will come into play.
If Gold price faces rejection once again near the $2,530 supply zone, a correction would ensue, with a daily closing below the 21-day SMA at $2,499 needed for a sustained downside.
A breach of the latter will challenge the previous week’s low of $2,472, followed by the symmetrical triangle resistance-turned-support at $2,461.
Gold FAQs
Gold has played a key role in human’s history as it has been widely used as a store of value and medium of exchange. Currently, apart from its shine and usage for jewelry, the precious metal is widely seen as a safe-haven asset, meaning that it is considered a good investment during turbulent times. Gold is also widely seen as a hedge against inflation and against depreciating currencies as it doesn’t rely on any specific issuer or government.
Central banks are the biggest Gold holders. In their aim to support their currencies in turbulent times, central banks tend to diversify their reserves and buy Gold to improve the perceived strength of the economy and the currency. High Gold reserves can be a source of trust for a country’s solvency. Central banks added 1,136 tonnes of Gold worth around $70 billion to their reserves in 2022, according to data from the World Gold Council. This is the highest yearly purchase since records began. Central banks from emerging economies such as China, India and Turkey are quickly increasing their Gold reserves.
Gold has an inverse correlation with the US Dollar and US Treasuries, which are both major reserve and safe-haven assets. When the Dollar depreciates, Gold tends to rise, enabling investors and central banks to diversify their assets in turbulent times. Gold is also inversely correlated with risk assets. A rally in the stock market tends to weaken Gold price, while sell-offs in riskier markets tend to favor the precious metal.
The price can move due to a wide range of factors. Geopolitical instability or fears of a deep recession can quickly make Gold price escalate due to its safe-haven status. As a yield-less asset, Gold tends to rise with lower interest rates, while higher cost of money usually weighs down on the yellow metal. Still, most moves depend on how the US Dollar (USD) behaves as the asset is priced in dollars (XAU/USD). A strong Dollar tends to keep the price of Gold controlled, whereas a weaker Dollar is likely to push Gold prices up.
Author

Dhwani Mehta
FXStreet
Residing in Mumbai (India), Dhwani is a Senior Analyst and Manager of the Asian session at FXStreet. She has over 10 years of experience in analyzing and covering the global financial markets, with specialization in Forex and commodities markets.