Gold Price Forecast: XAU/USD recovery faces healthy resistance; will buyers succeed?
- Gold price eyes weekly declines, despite the recent turnaround from weekly lows.
- Sustained bets for December Fed rate cut bets and Russia-Ukraine geopolitical woes support Gold price.
- Technically, Gold price faces stiff resistance on the daily chart while the RSI regains the 50 level.

Gold price extends its gradual recovery mode and tests the critical $2,670 resistance early Friday, having hit a weekly low of $2,605 on Tuesday. A broadly subdued US Dollar (USD) performance alongside the US Treasury bond yields lend support to the Gold price upswing.
Gold price awaits fresh catalysts for the next direction
Despite the growing risks of a global tariff war, US President-elect Donald Trump’s tariffs announcements earlier in the week, the USD maintained its downbeat performance against its major rivals amid sustained bets that the US Federal Reserve (Fed) will lower interest rates by 25 basis points (bps) in December.
The in-line with expectations US Personal Consumption Expenditure (PCE) Price Index data released on Wednesday failed to deter Fed rate cut expectations as markets now pricing in about a 63% chance of a December Fed rate reduction, the CME Group’s FedWatch Tool shows, up from about 55% seen a week ago.
The dovish sentiment around the Fed’s next policy action continues to underpin the non-interest-bearing Gold price.
Meanwhile, the traditional safe-haven Gold price also capitalizes on renewed geopolitical tensions between Russia and Ukraine after several media outlets reported that Russian President Vladimir Putin threatened to attack decision-making centres in the Ukrainian capital of Kyiv with the country's new ballistic missile, Oreshnik.
This came after Moscow launched a “comprehensive” strike on Ukraine’s energy grid overnight in retaliation to Ukraine’s "continued attacks" using US-supplied Atacms missiles on Russian soil.”
Looking ahead, it remains to be seen if the Gold price will build on the recovery momentum amid thin trading conditions, as US traders could be away due to the Thanksgiving long weekend. Further, the Gold price could also benefit if the US Dollar sees a fresh leg lower amid extended declines in the USD/JPY pair.
The sharp rebound in the Japanese Yen comes after the Tokyo inflation data arrived hotter than expected and bolstered rate hike bets from the Bank of Japan (BoJ) next month.
It’s an empty US docket on Friday, therefore, the Eurozone inflation report could somewhat drive the sentiment along with the end-of-the-week flows, impacting the Gold price action.
Gold price technical analysis: Daily chart
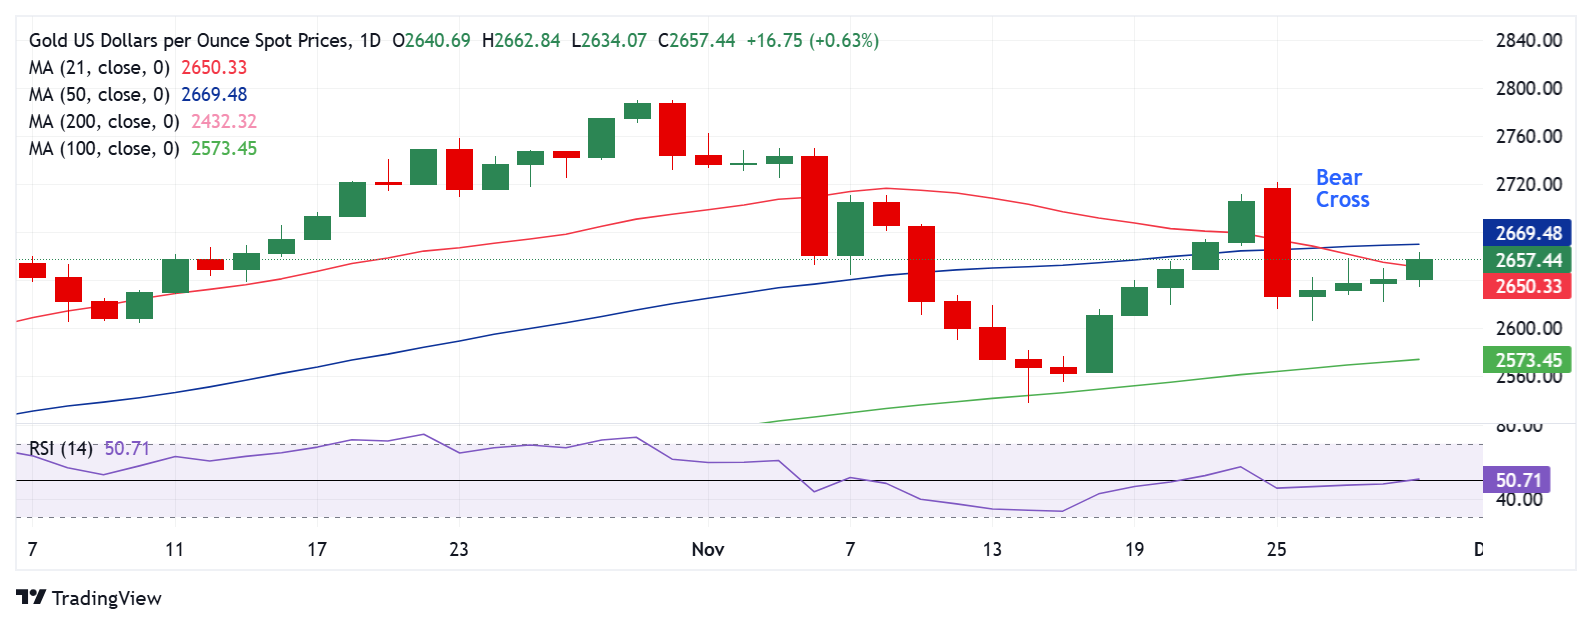
Technically, Gold buyers are fighting back control, justified by the 14-day Relative Strength Index (RSI) briefly recapturing the 50 level.
However, with the Bear Cross still playing out, Gold price’s bullish conviction could likely peter out.
If Gold buyers fail to find acceptance above the 50-day SMA at $2,670 on a daily closing basis, sellers will likely jump back, sending the bright metal back toward the previous day’s low of $2,621.
The next support aligns at the weekly low of $2,605, below which a drop toward the 100-day SMA at $2,573 cannot be ruled out.
On the flip side, a sustained move above the 50-day SMA at $2,670 could open up the upside toward the $2,700 level.
Further north, the November 25 high of $2,721 will be put to the test.
Gold FAQs
Gold has played a key role in human’s history as it has been widely used as a store of value and medium of exchange. Currently, apart from its shine and usage for jewelry, the precious metal is widely seen as a safe-haven asset, meaning that it is considered a good investment during turbulent times. Gold is also widely seen as a hedge against inflation and against depreciating currencies as it doesn’t rely on any specific issuer or government.
Central banks are the biggest Gold holders. In their aim to support their currencies in turbulent times, central banks tend to diversify their reserves and buy Gold to improve the perceived strength of the economy and the currency. High Gold reserves can be a source of trust for a country’s solvency. Central banks added 1,136 tonnes of Gold worth around $70 billion to their reserves in 2022, according to data from the World Gold Council. This is the highest yearly purchase since records began. Central banks from emerging economies such as China, India and Turkey are quickly increasing their Gold reserves.
Gold has an inverse correlation with the US Dollar and US Treasuries, which are both major reserve and safe-haven assets. When the Dollar depreciates, Gold tends to rise, enabling investors and central banks to diversify their assets in turbulent times. Gold is also inversely correlated with risk assets. A rally in the stock market tends to weaken Gold price, while sell-offs in riskier markets tend to favor the precious metal.
The price can move due to a wide range of factors. Geopolitical instability or fears of a deep recession can quickly make Gold price escalate due to its safe-haven status. As a yield-less asset, Gold tends to rise with lower interest rates, while higher cost of money usually weighs down on the yellow metal. Still, most moves depend on how the US Dollar (USD) behaves as the asset is priced in dollars (XAU/USD). A strong Dollar tends to keep the price of Gold controlled, whereas a weaker Dollar is likely to push Gold prices up.
Author

Dhwani Mehta
FXStreet
Residing in Mumbai (India), Dhwani is a Senior Analyst and Manager of the Asian session at FXStreet. She has over 10 years of experience in analyzing and covering the global financial markets, with specialization in Forex and commodities markets.