XAU/USD Current price: $2,359.66
- A batch of United States tepid data boosted the mood and put the US Dollar under selling pressure.
- Wall Street recovered its poise despite softer-than-expected US employment and growth figures.
- XAU/USD turned bullish in the near term and may run past the June high at $2,368.59.
A sharp US Dollar decline pushed XAU/USD above the $2,360 mark for the first time in over two weeks. A rough of tepid United States (US) data pushed the US Dollar down, although the major catalyst was the ISM Services PMI, which unexpectedly dropped to 48.8 in June after posting 53.8 in May, also missing the expected 52.5.
The country also reported that Challenger Job Cuts showed US-based employers announced 48,786 cuts in June, down 23.6% from the 63,816 cuts announced in May. Furthermore, the May Goods and Services Trade Balance posted a deficit of $75.1 billion, better than anticipated, while Initial Jobless Claims for the week ended June 28 surged to 238K, worse than the 235K anticipated by market players. Finally, the ADP report on private job creation showed that the sector added 150K new positions in June, below the revised 157K from May and missing the 160K expected.
Wall Street also gained impetus as a result of the better market mood. Only the Dow Jones Industrial Average trades in the red, down 0.12%. The S&P500 and the Nasdaq Composite, however, trade in the green, while government bond yields are down, further weighing on the Greenback.
XAU/USD short-term technical outlook
From a technical point of view, the daily chat for the XAU/USD pair shows the bright metal met buyers around a flat 20 Simple Moving Average (SMA), currently at around $2,330, while the 100 and 200 SMAs keep heading north far below the shorter one. Technical indicators, in the meantime, picked up momentum within positive levels, in line with another leg north. A relevant resistance level can be found at $2,368.59, the June monthly high.
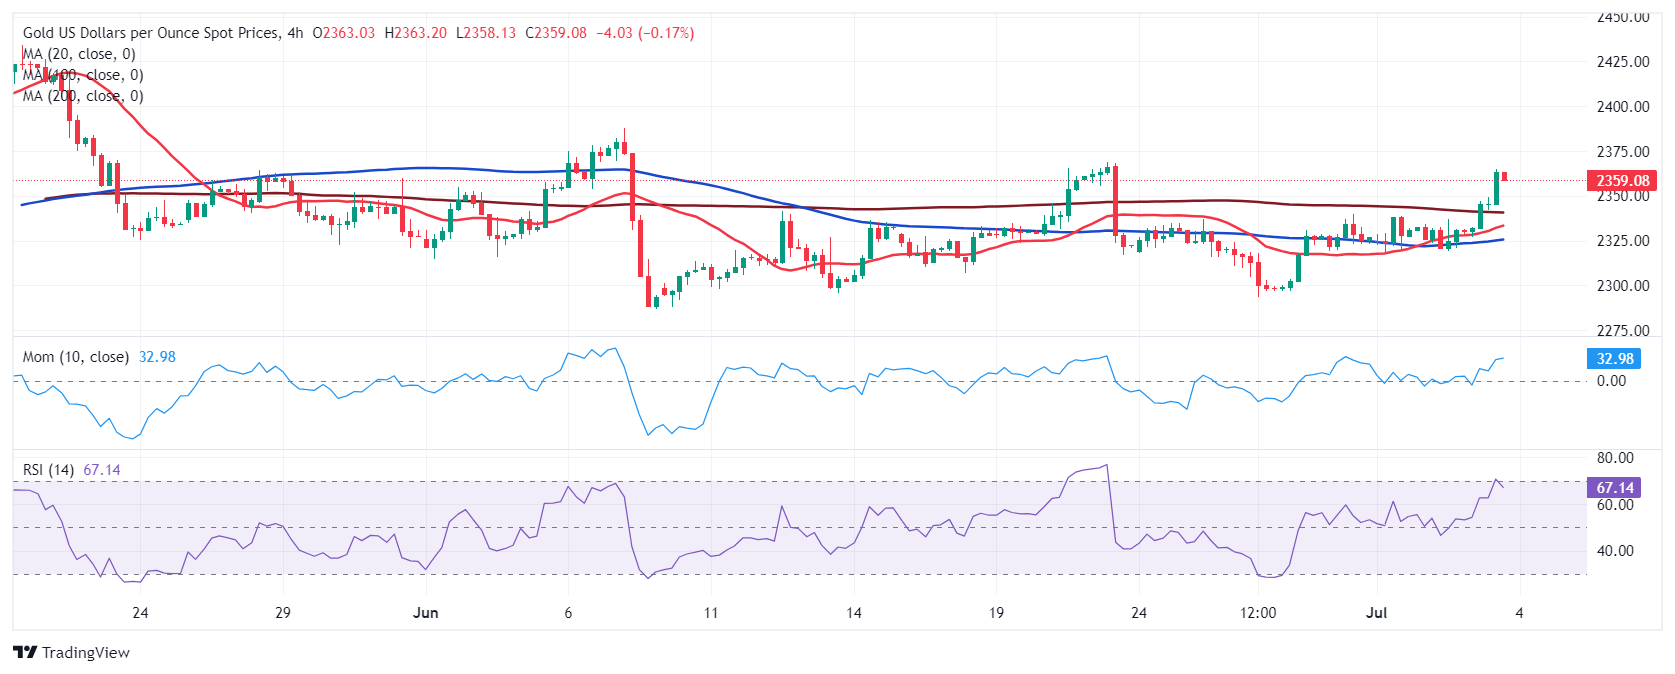
In the near term, and according to the 4-hour chart, the risk also skews to the upside. XAU/USD trades above all its moving averages, although the 20 SMA advances between directionless, longer ones. Technical indicators, in the meantime, flirt with overbought readings without signs of upward exhaustion.
Support levels: 2,341.50 2,329.20 2,313.60
Resistance levels: 2,368.60, 2,387.60 2,400.00
Information on these pages contains forward-looking statements that involve risks and uncertainties. Markets and instruments profiled on this page are for informational purposes only and should not in any way come across as a recommendation to buy or sell in these assets. You should do your own thorough research before making any investment decisions. FXStreet does not in any way guarantee that this information is free from mistakes, errors, or material misstatements. It also does not guarantee that this information is of a timely nature. Investing in Open Markets involves a great deal of risk, including the loss of all or a portion of your investment, as well as emotional distress. All risks, losses and costs associated with investing, including total loss of principal, are your responsibility. The views and opinions expressed in this article are those of the authors and do not necessarily reflect the official policy or position of FXStreet nor its advertisers. The author will not be held responsible for information that is found at the end of links posted on this page.
If not otherwise explicitly mentioned in the body of the article, at the time of writing, the author has no position in any stock mentioned in this article and no business relationship with any company mentioned. The author has not received compensation for writing this article, other than from FXStreet.
FXStreet and the author do not provide personalized recommendations. The author makes no representations as to the accuracy, completeness, or suitability of this information. FXStreet and the author will not be liable for any errors, omissions or any losses, injuries or damages arising from this information and its display or use. Errors and omissions excepted.
The author and FXStreet are not registered investment advisors and nothing in this article is intended to be investment advice.
Recommended Content
Editors’ Picks

AUD/USD weighed down by China, tariffs
AUD/USD remained on the back foot, slipping back to the area of multi-year lows around 0.5950 on the back of mounting fears surrounding tariffs and their impact on the Chinese economy.

EUR/USD refocuses on 1.1000 amid tariffs jitters
EUR/USD reversed two daily pullbacks in a row an d managed to advance to the boundaries of the 1.1000 barrier on the back of fresh weakness hurting the US Dollar and persistent tariff fears.

Gold erases gains, back to the $2,980 zone
Gold prices now lose extra ground and slip back to the area of daily troughs near $2,980 mark per troy ounce following an unsuccesful attempt to maintain the trade above the critical $3,000 level earlier in the day.

XRP drops 3% as Ripple announces $1.25 billion acquisition of prime brokerage firm Hidden Road
Ripple announced on Tuesday that it is acquiring prime brokerage firm Hidden Road to enhance its institutional offerings and increase the adoption of the RLUSD stablecoin and the XRP Ledger (XRPL).

The Fed is looking at a hefty price level
We are still in thrall to tariffs, the faux-macro “data” driving markets. The WSJ editorial board advised other countries to take their tariffs to zero so that Trump’s “reciprocal” tariffs will have to be zero, too. Cute, but no cigar.

The Best brokers to trade EUR/USD
SPONSORED Discover the top brokers for trading EUR/USD in 2025. Our list features brokers with competitive spreads, fast execution, and powerful platforms. Whether you're a beginner or an expert, find the right partner to navigate the dynamic Forex market.